Where the Ground Gives Way…
This is a GIS-based research project examining how seismic liquefaction hazards intersect with socioeconomic vulnerability in the San Francisco Bay Area. Building on earlier work focused on Los Angeles County, this expanded analysis incorporates liquefaction zones, Quaternary fault data, and per capita income across four counties: San Francisco, Alameda, San Mateo, and Santa Clara, to explore how geologic risk and economic disadvantage spatially overlap.
One of the most challenging aspects of this project was working with socioeconomic data from raw Census sources. Transforming that data into a format suitable for spatial analysis required careful preprocessing, normalization, and joins before it could be meaningfully integrated with geologic hazard datasets. Developing this workflow from raw tabular Census data to mapped, interpretable socioeconomic patterns was a critical step in ensuring the analysis was both accurate and visually legible.
Using ArcGIS Pro, I designed a workflow that utilized vector hazard layers (USGS) with Census-derived economic indicators, emphasizing cartographic clarity and comparability across counties. Particular attention was given to classification choices, symbology, and layout so that patterns of vulnerability could be interpreted by non-technical audiences, not just GIS specialists.
The resulting maps highlight areas where liquefaction risk coincides with lower per capita income, raising important questions about equity in disaster preparedness, mitigation planning, and post-event recovery. This project reinforced my interest in using GIS and cartography as tools for translating complex spatial data into insights that can support more informed and equitable decision-making.
This work was presented at multiple academic venues and recognized for both its analytical rigor and visual communication, including first place in the undergraduate poster competition at the California Geographical Society Conference, Outstanding Poster at Pasadena City College’s Natural Sciences Poster Session, and recognition at the Los Angeles Geographical Society Student Symposium.

Final Poster Presented at the CGS Conference in Turlock, CA - April 2025
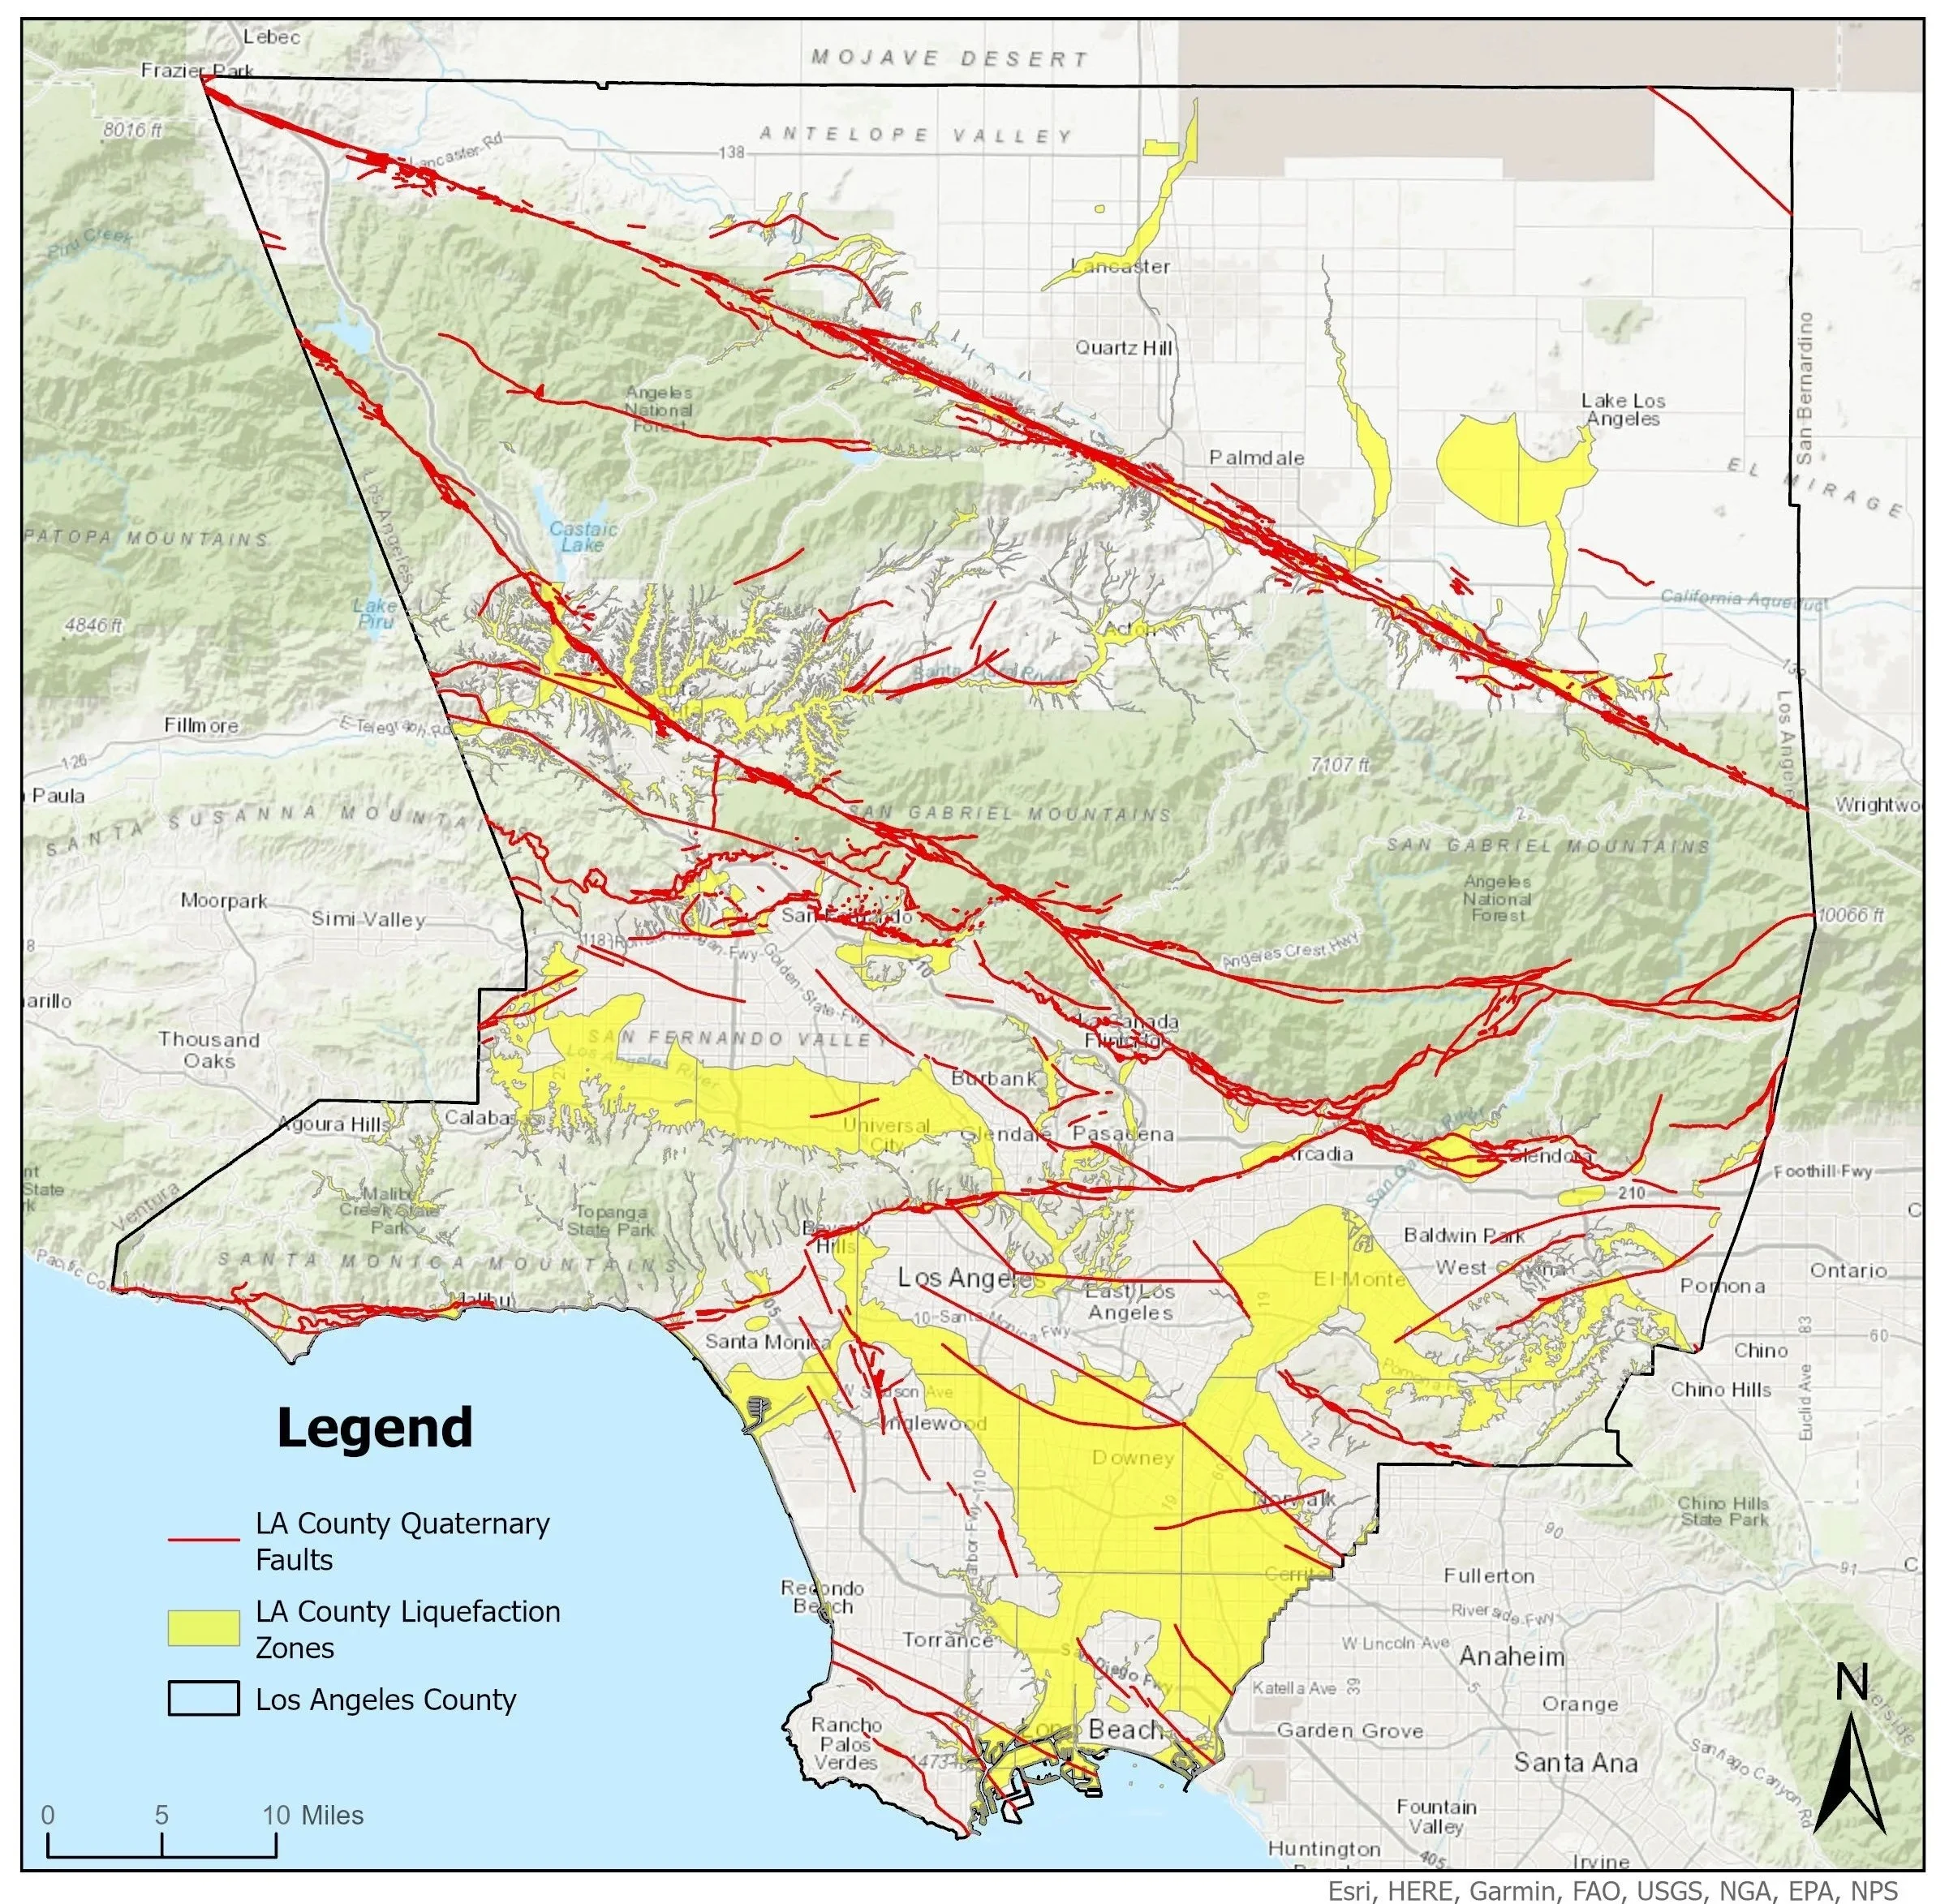
Los Angeles County Seismic Risks Map
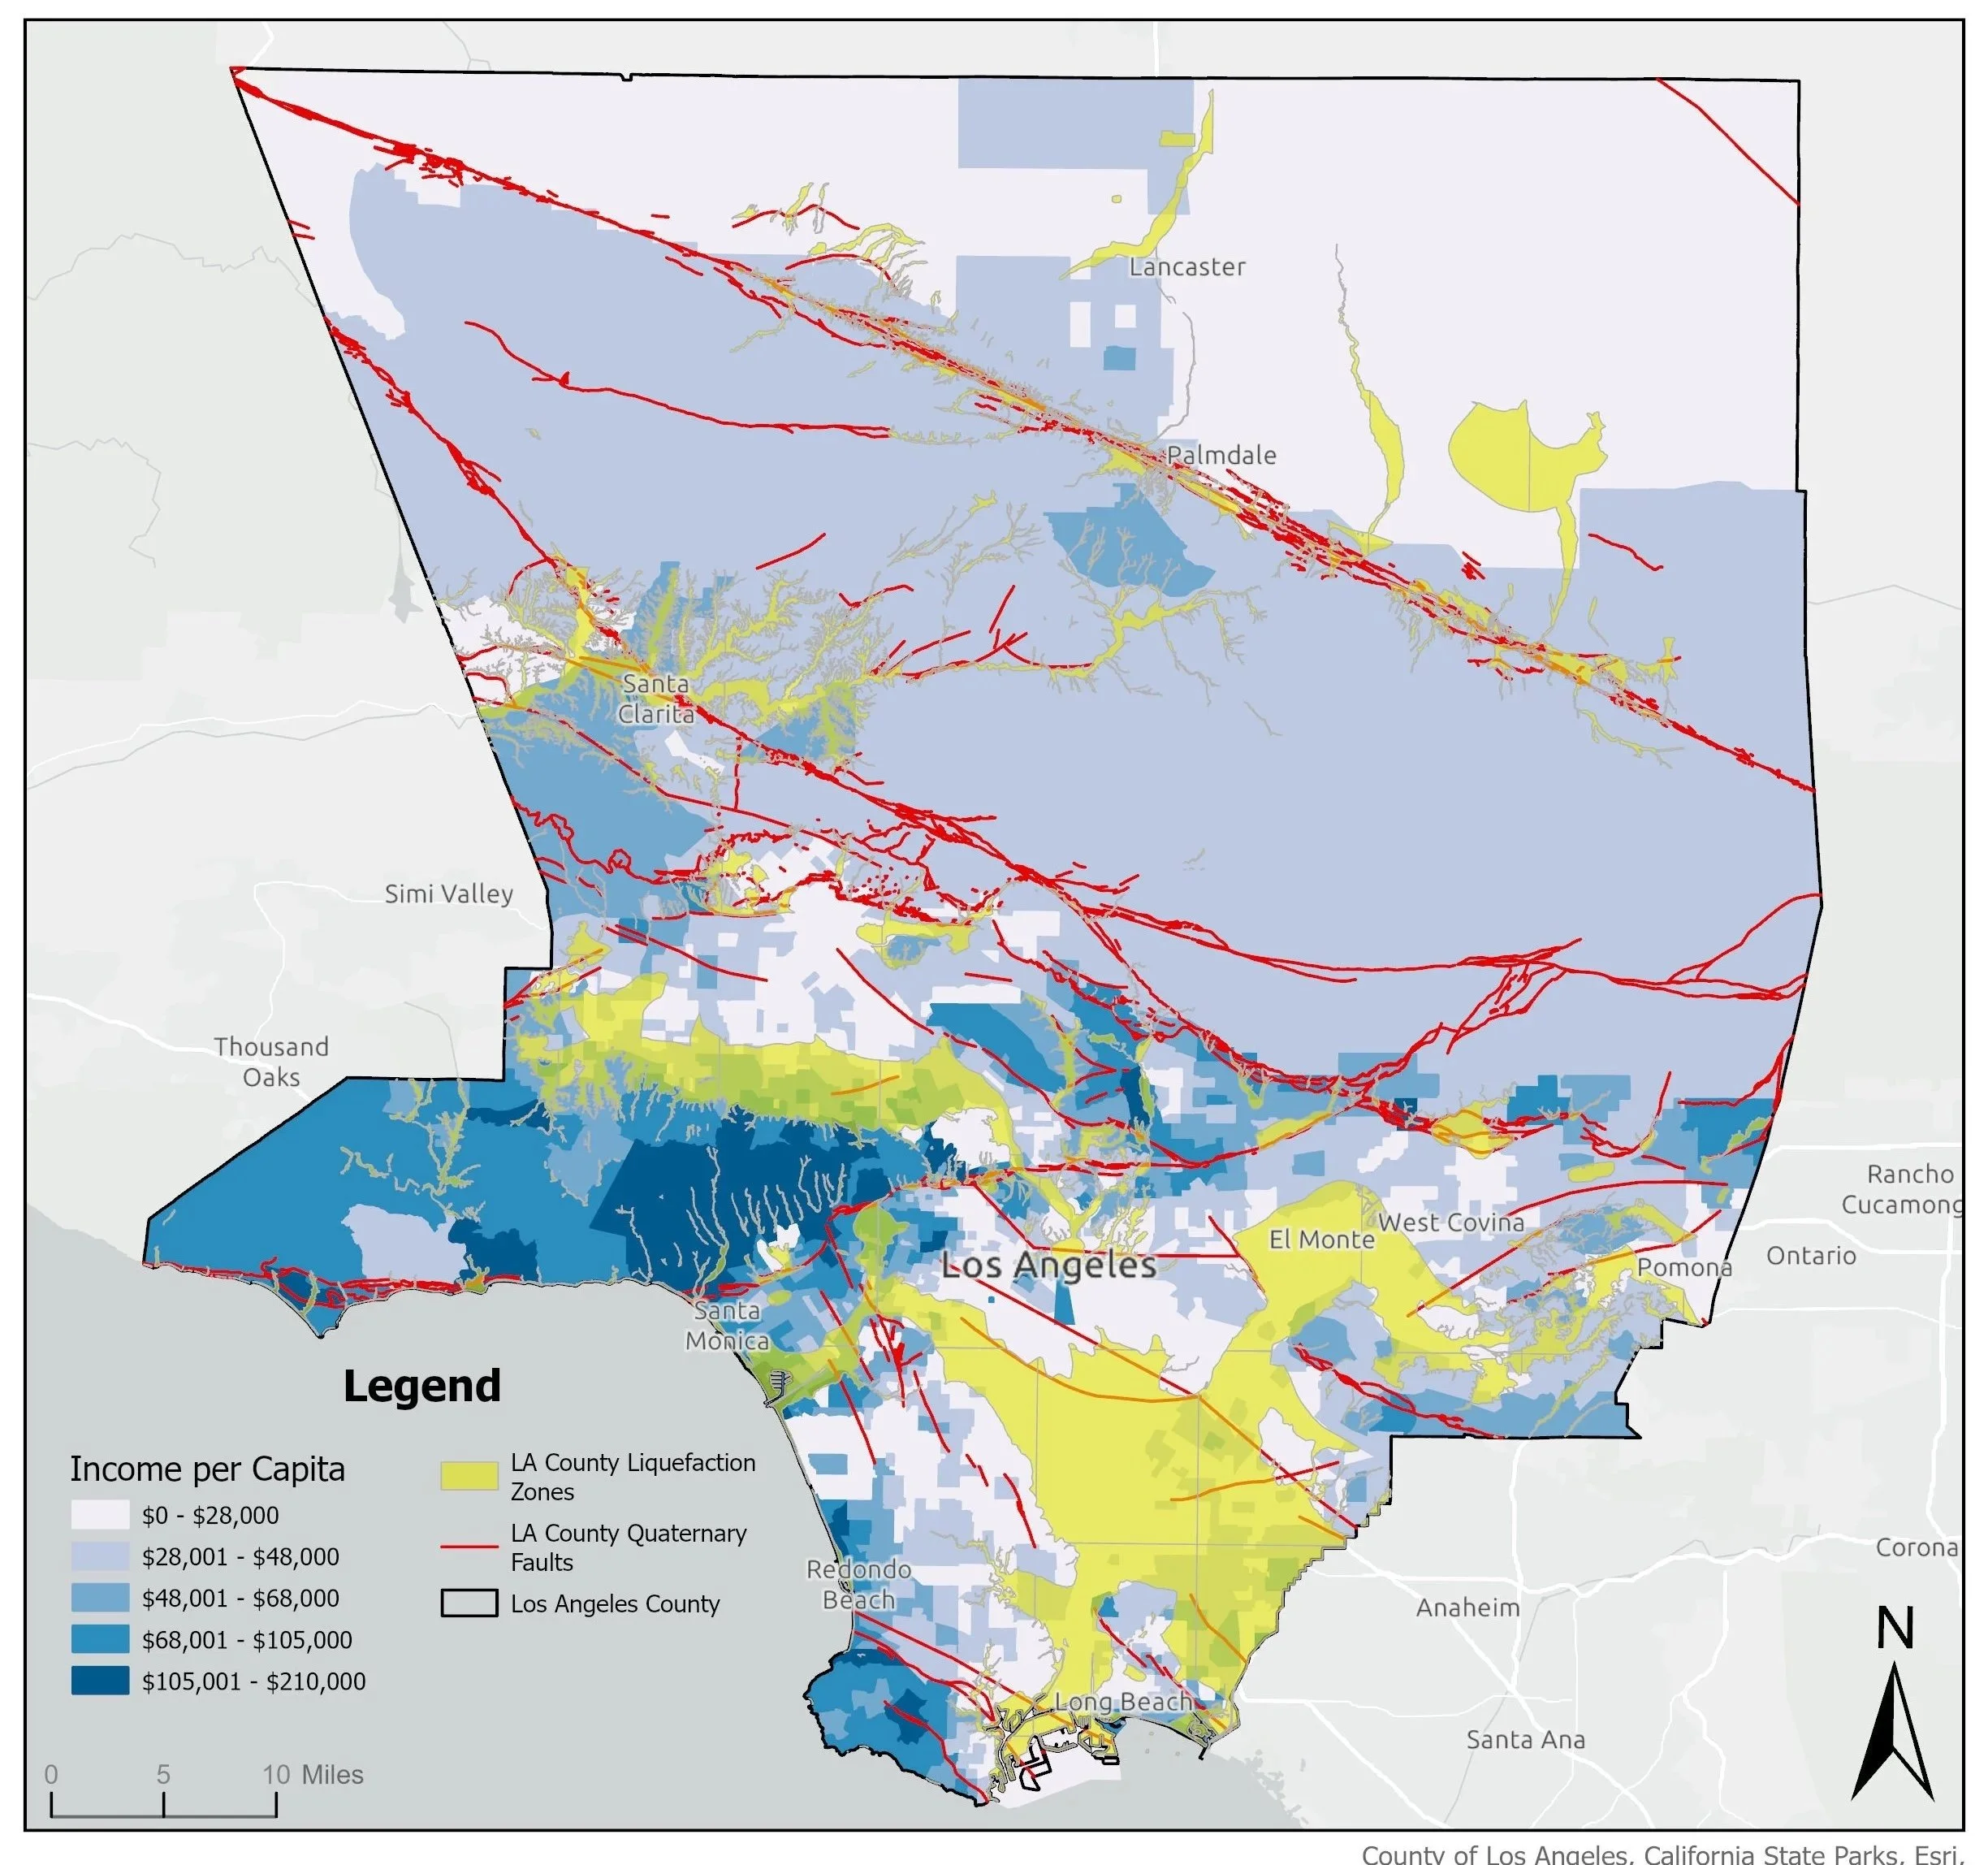
Los Angeles County Seismic Risk/Per Capita Income Spatial Analysis Map
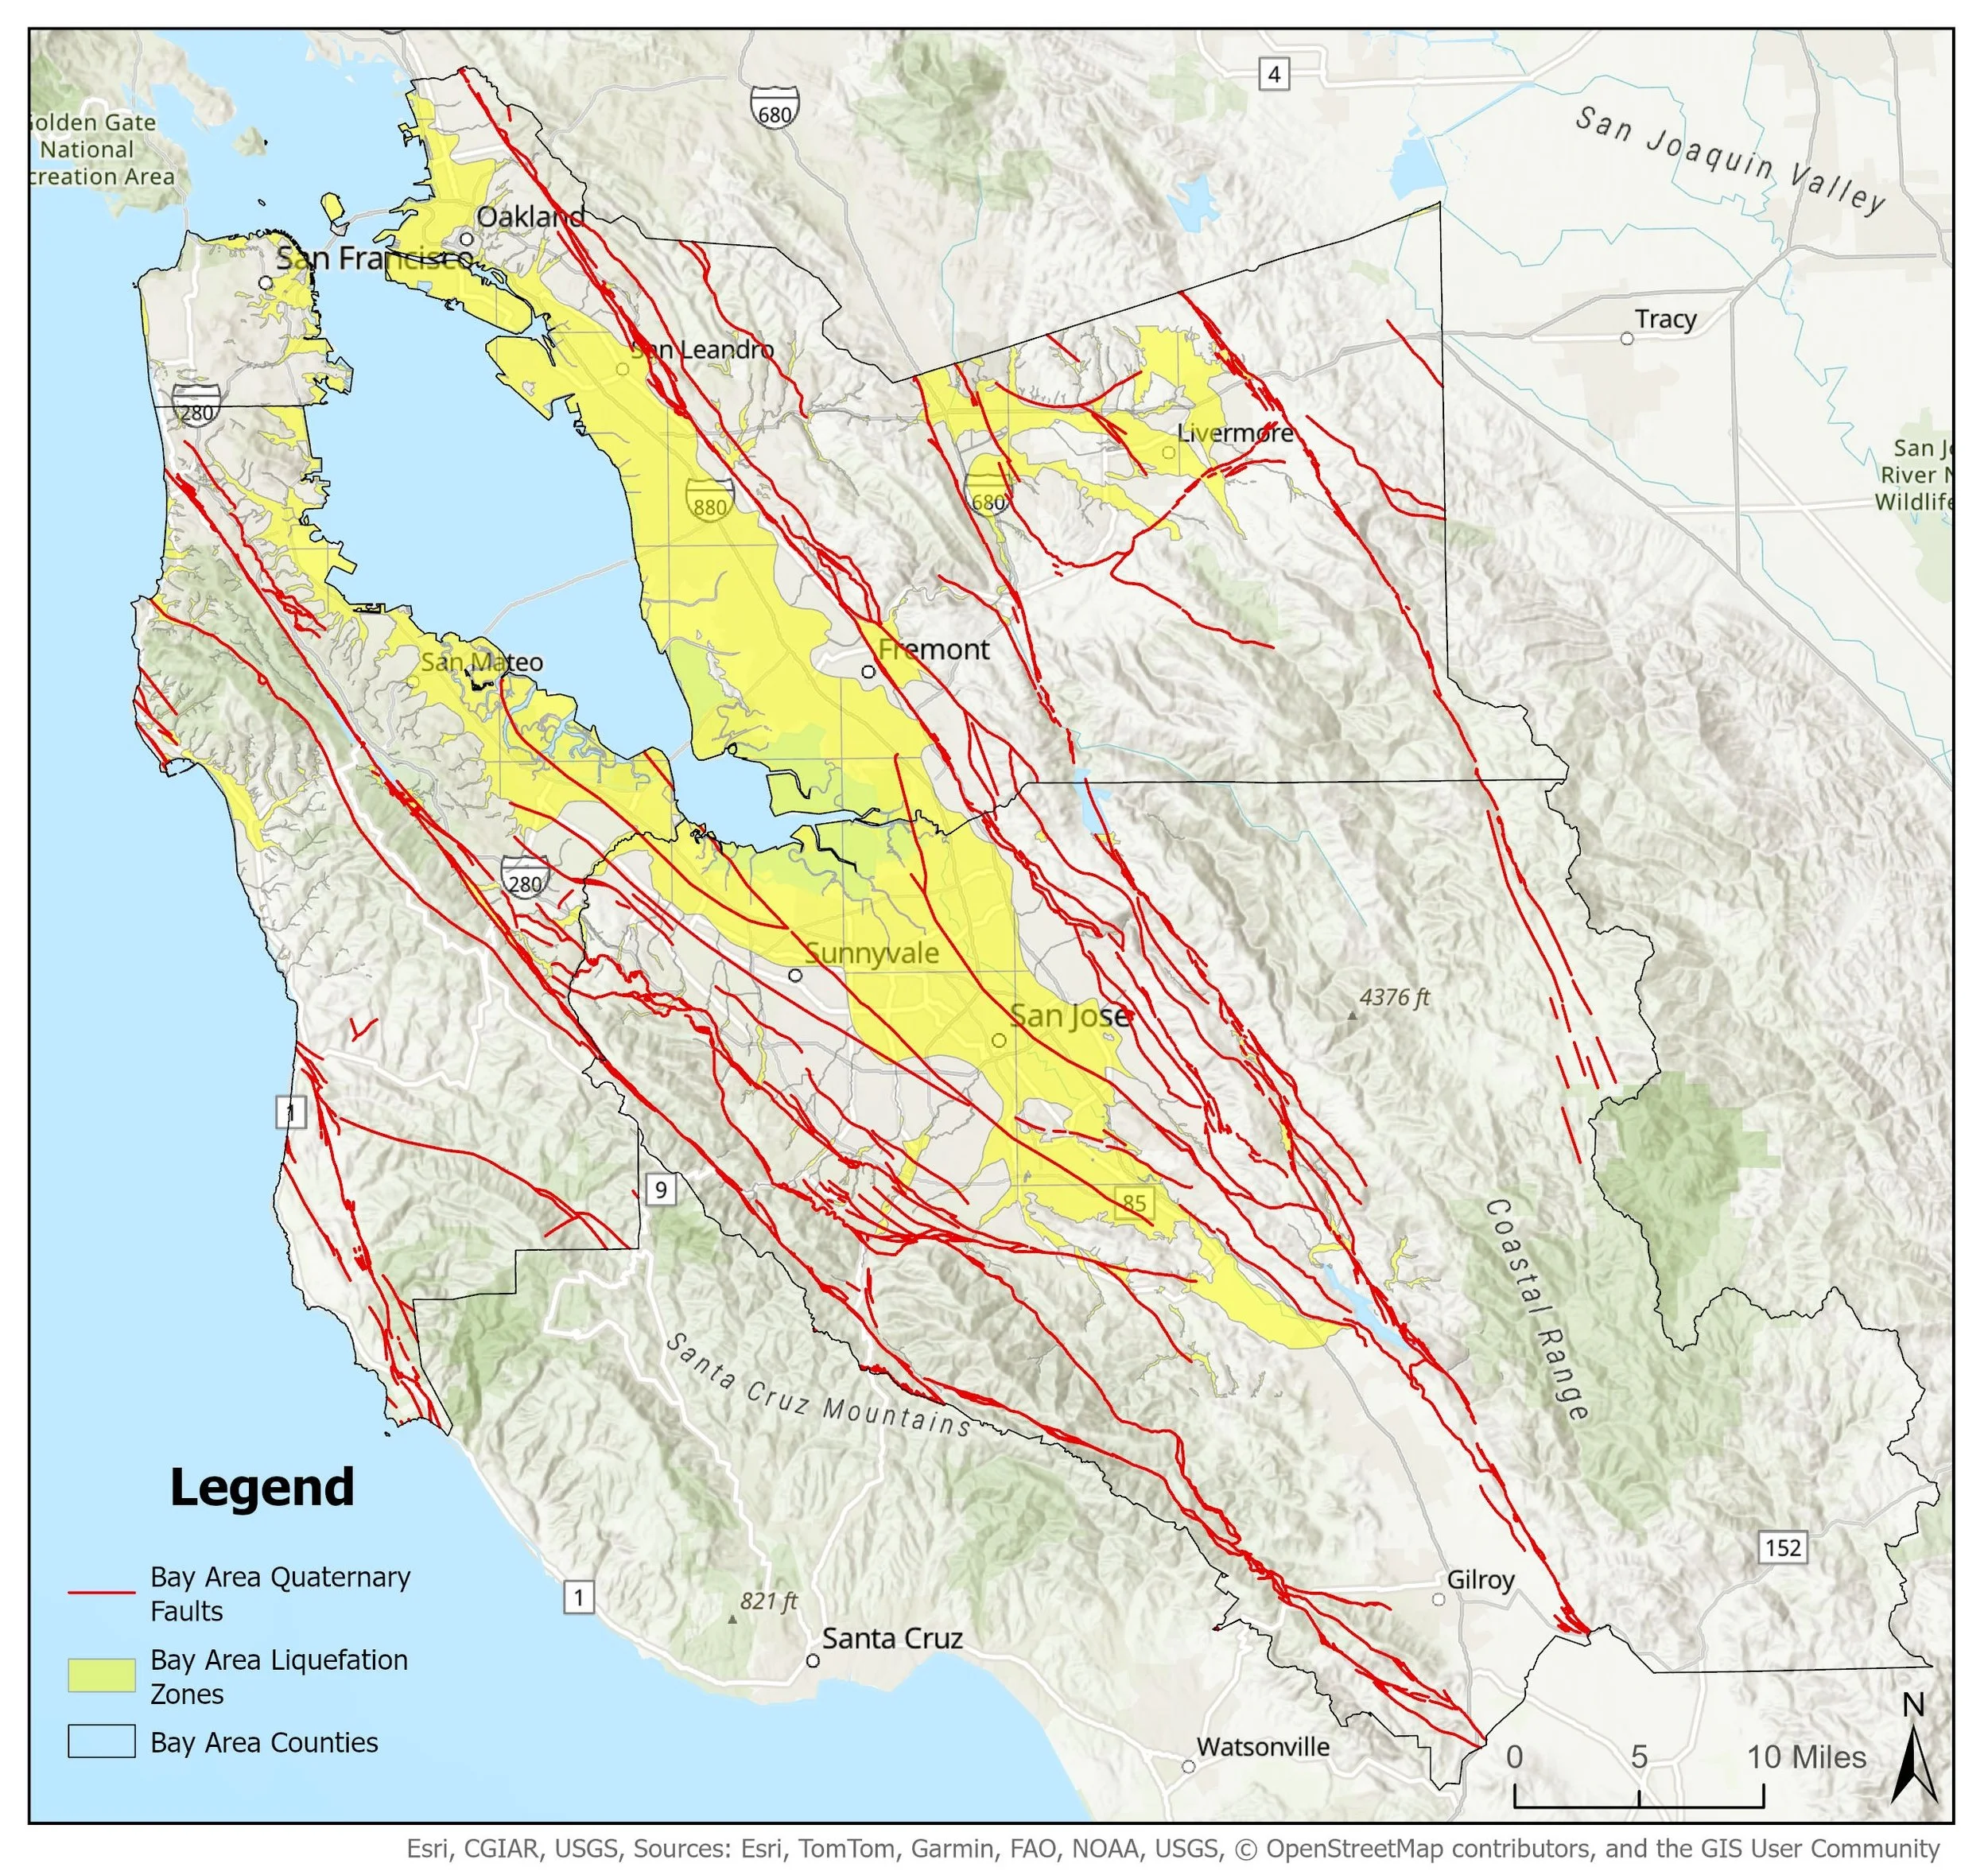
Bay Area Counties Seismic Risks Map
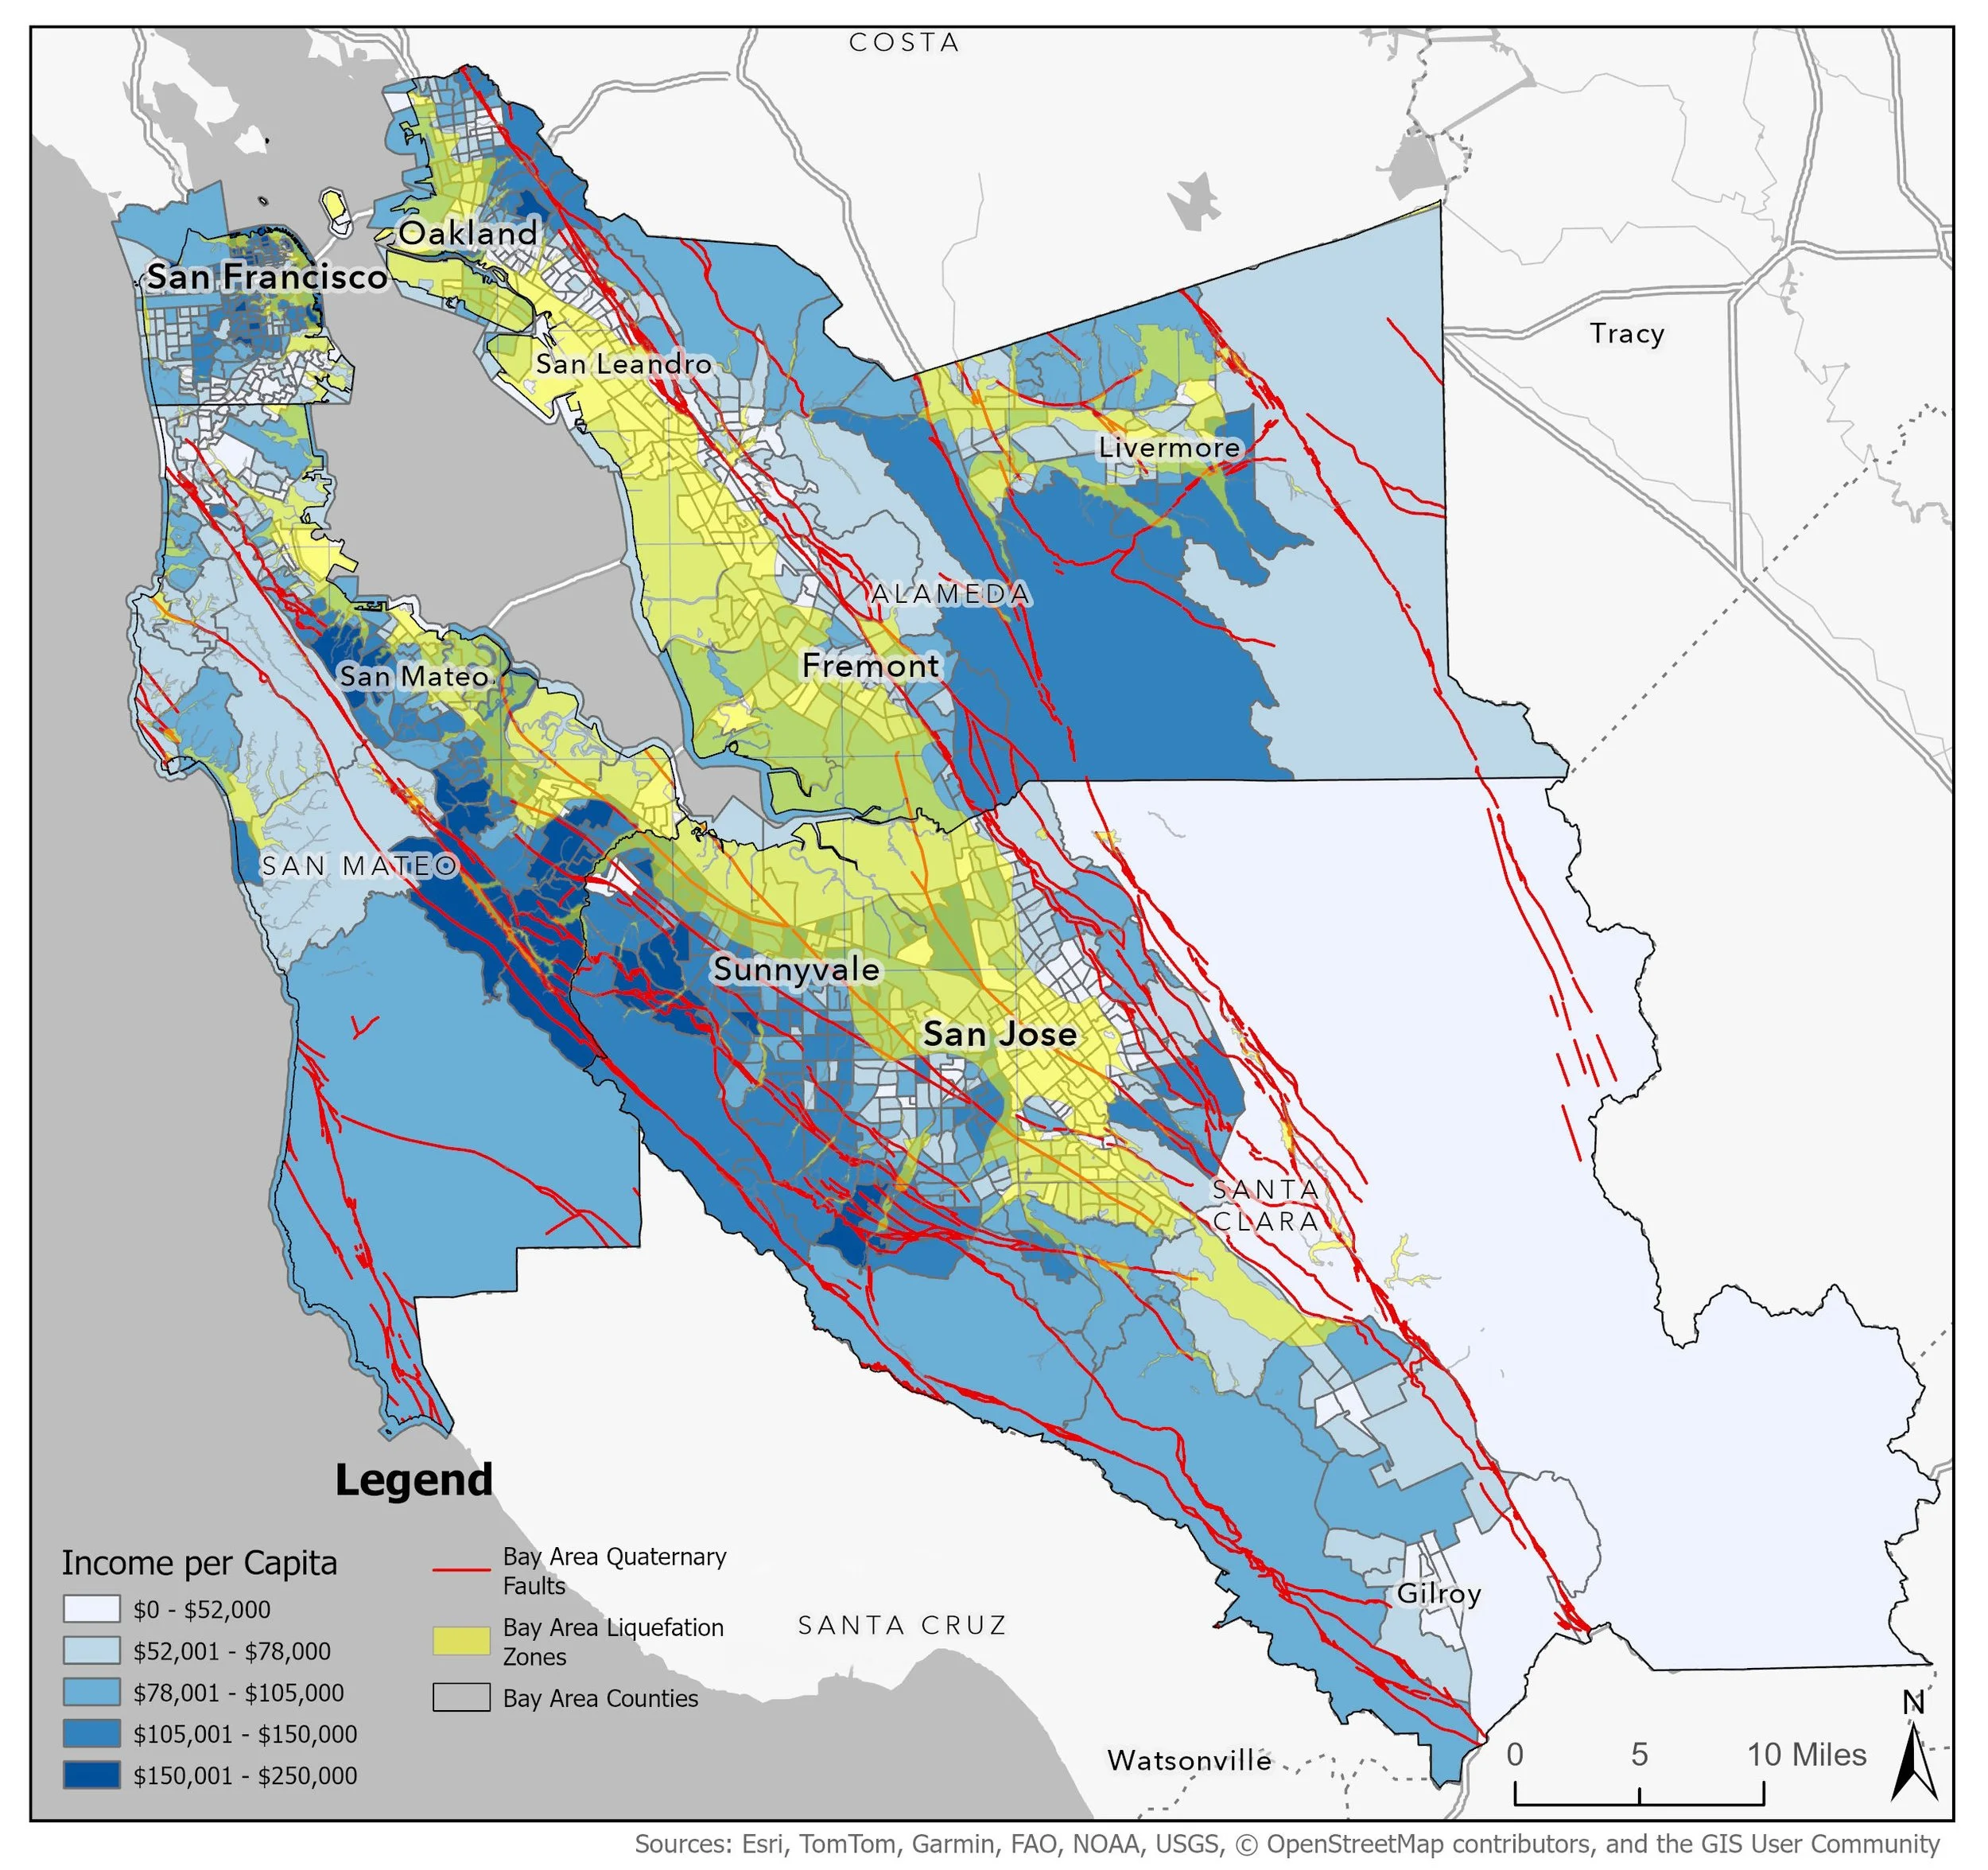
Bay Area Counties Seismic Risk/Per Capita Income Spatial Analysis Map
Key Takeaways
Integrating seismic hazard data with socioeconomic indicators reveals spatial patterns of vulnerability that are not apparent when datasets are viewed independently.
Cartographic choices such as classification, symbology, and scale play a critical role in making hazard information interpretable for non-technical audiences.
GIS-based visualization can support more equitable discussions around disaster preparedness and risk communication.