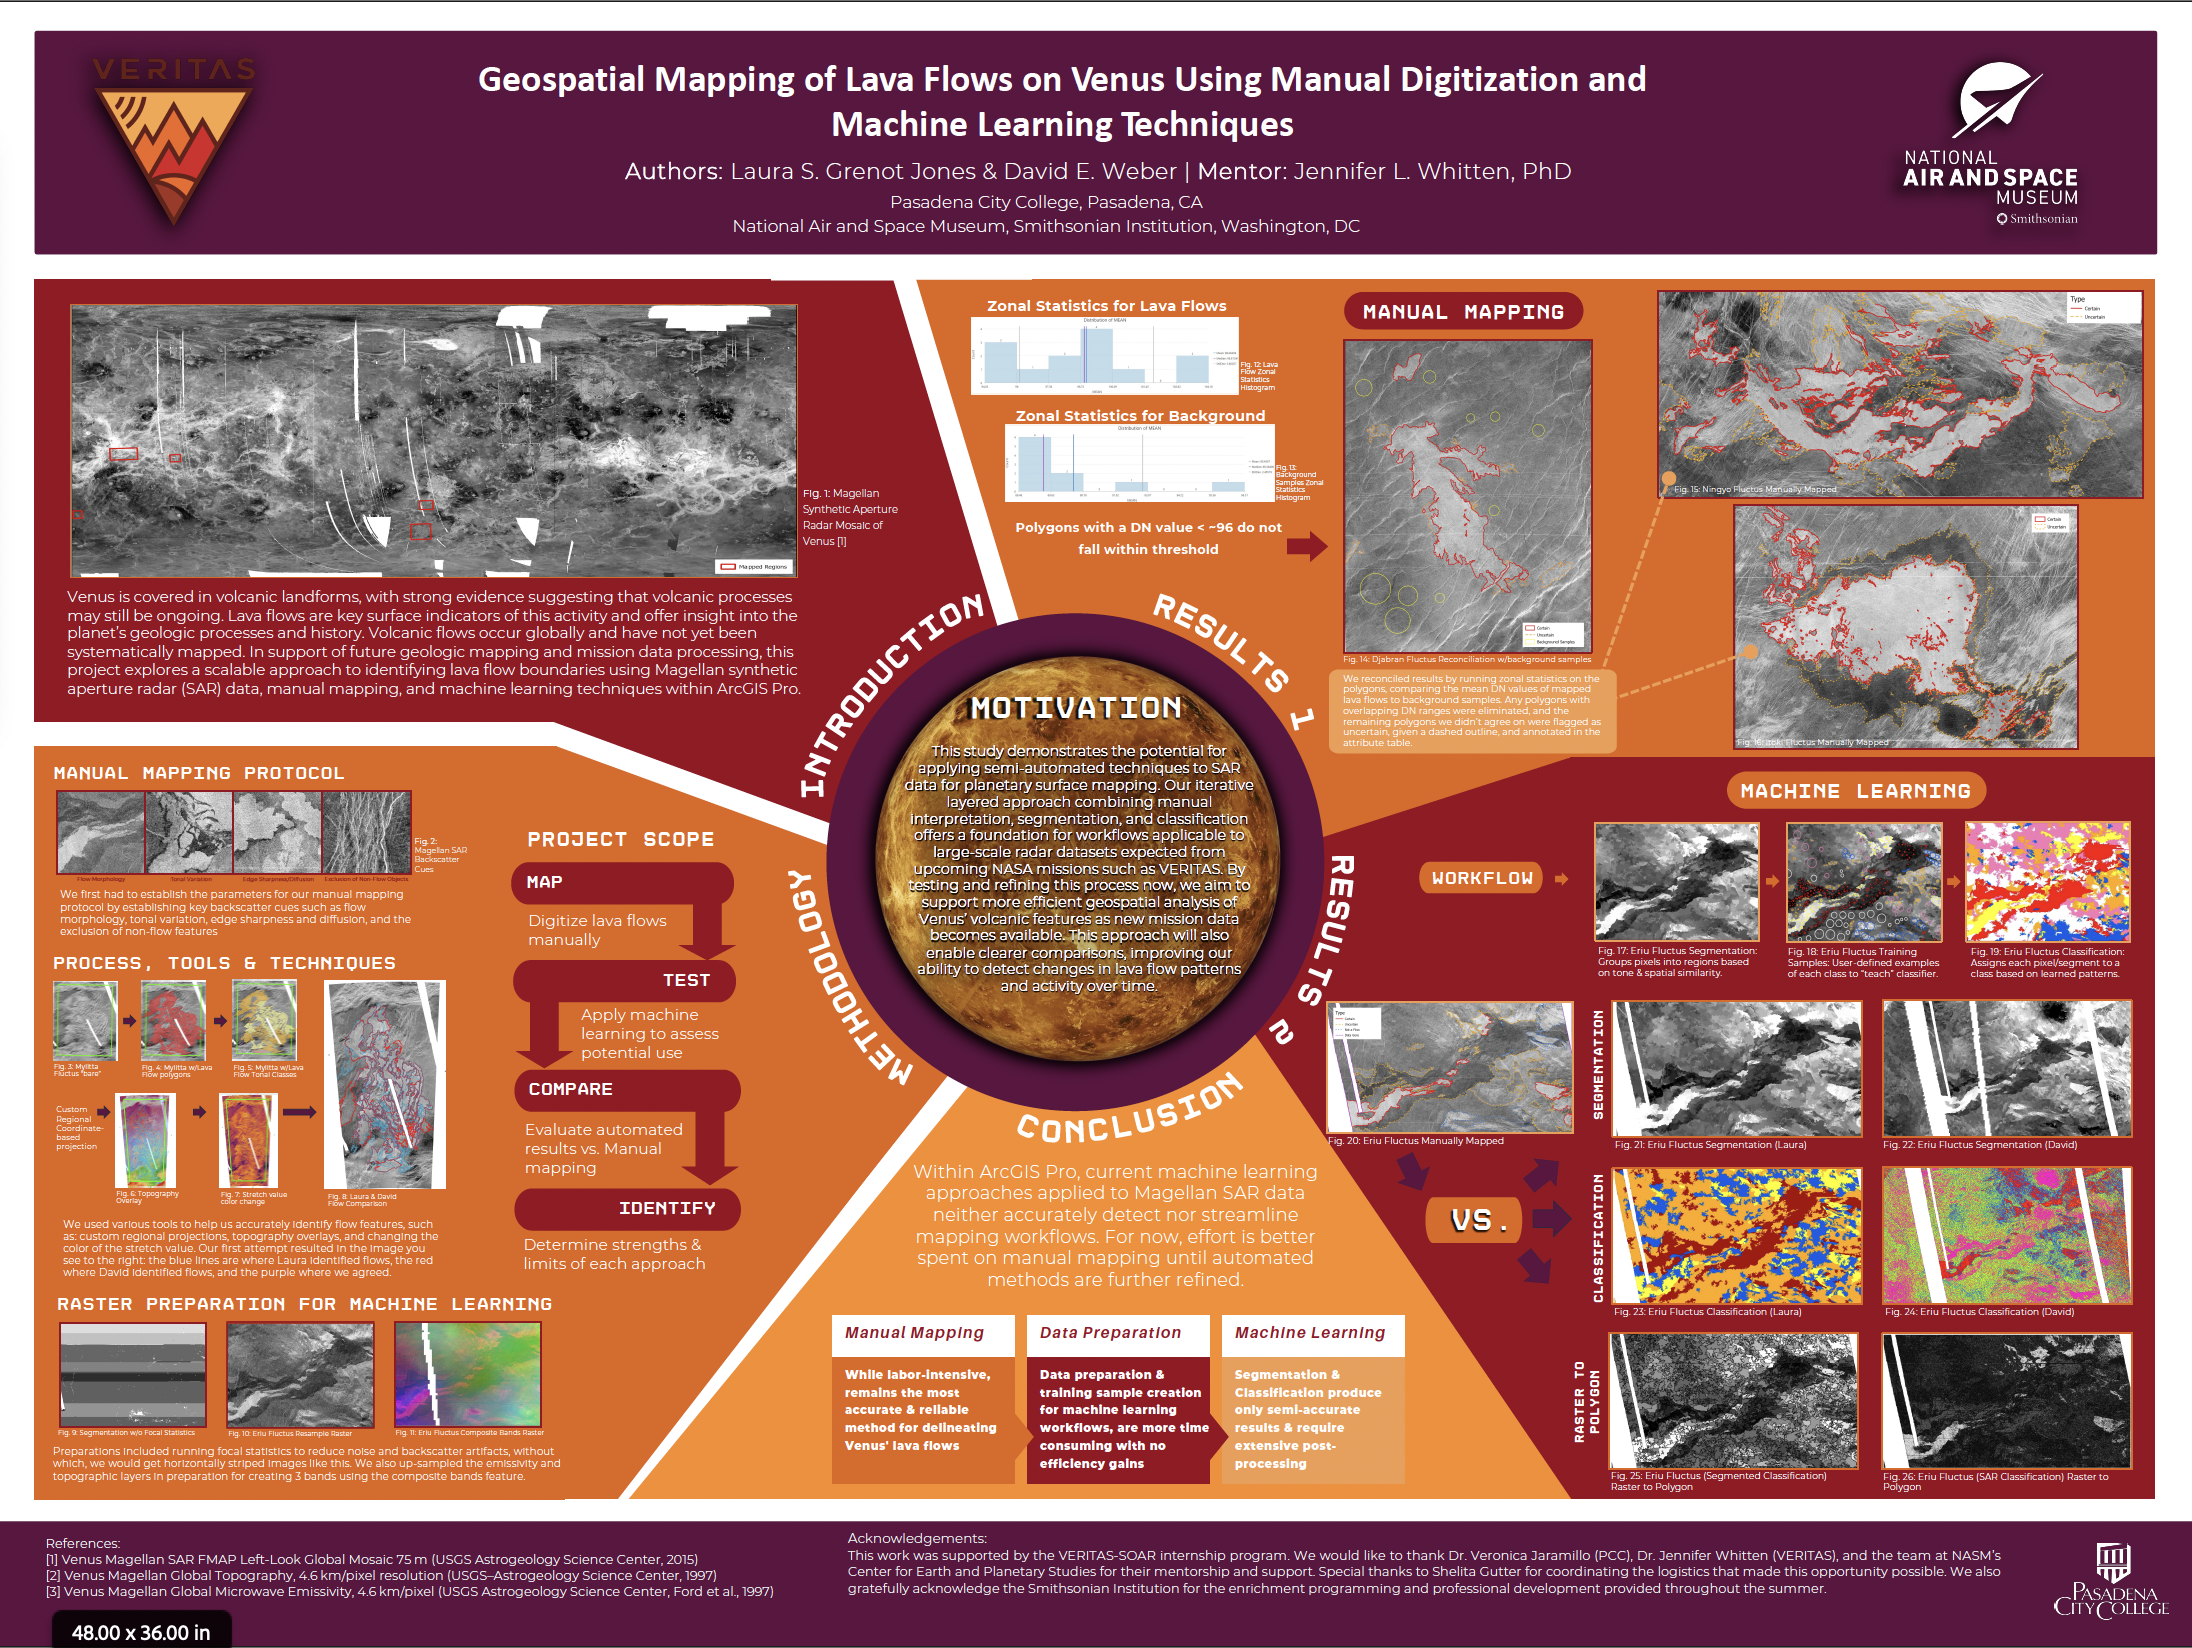
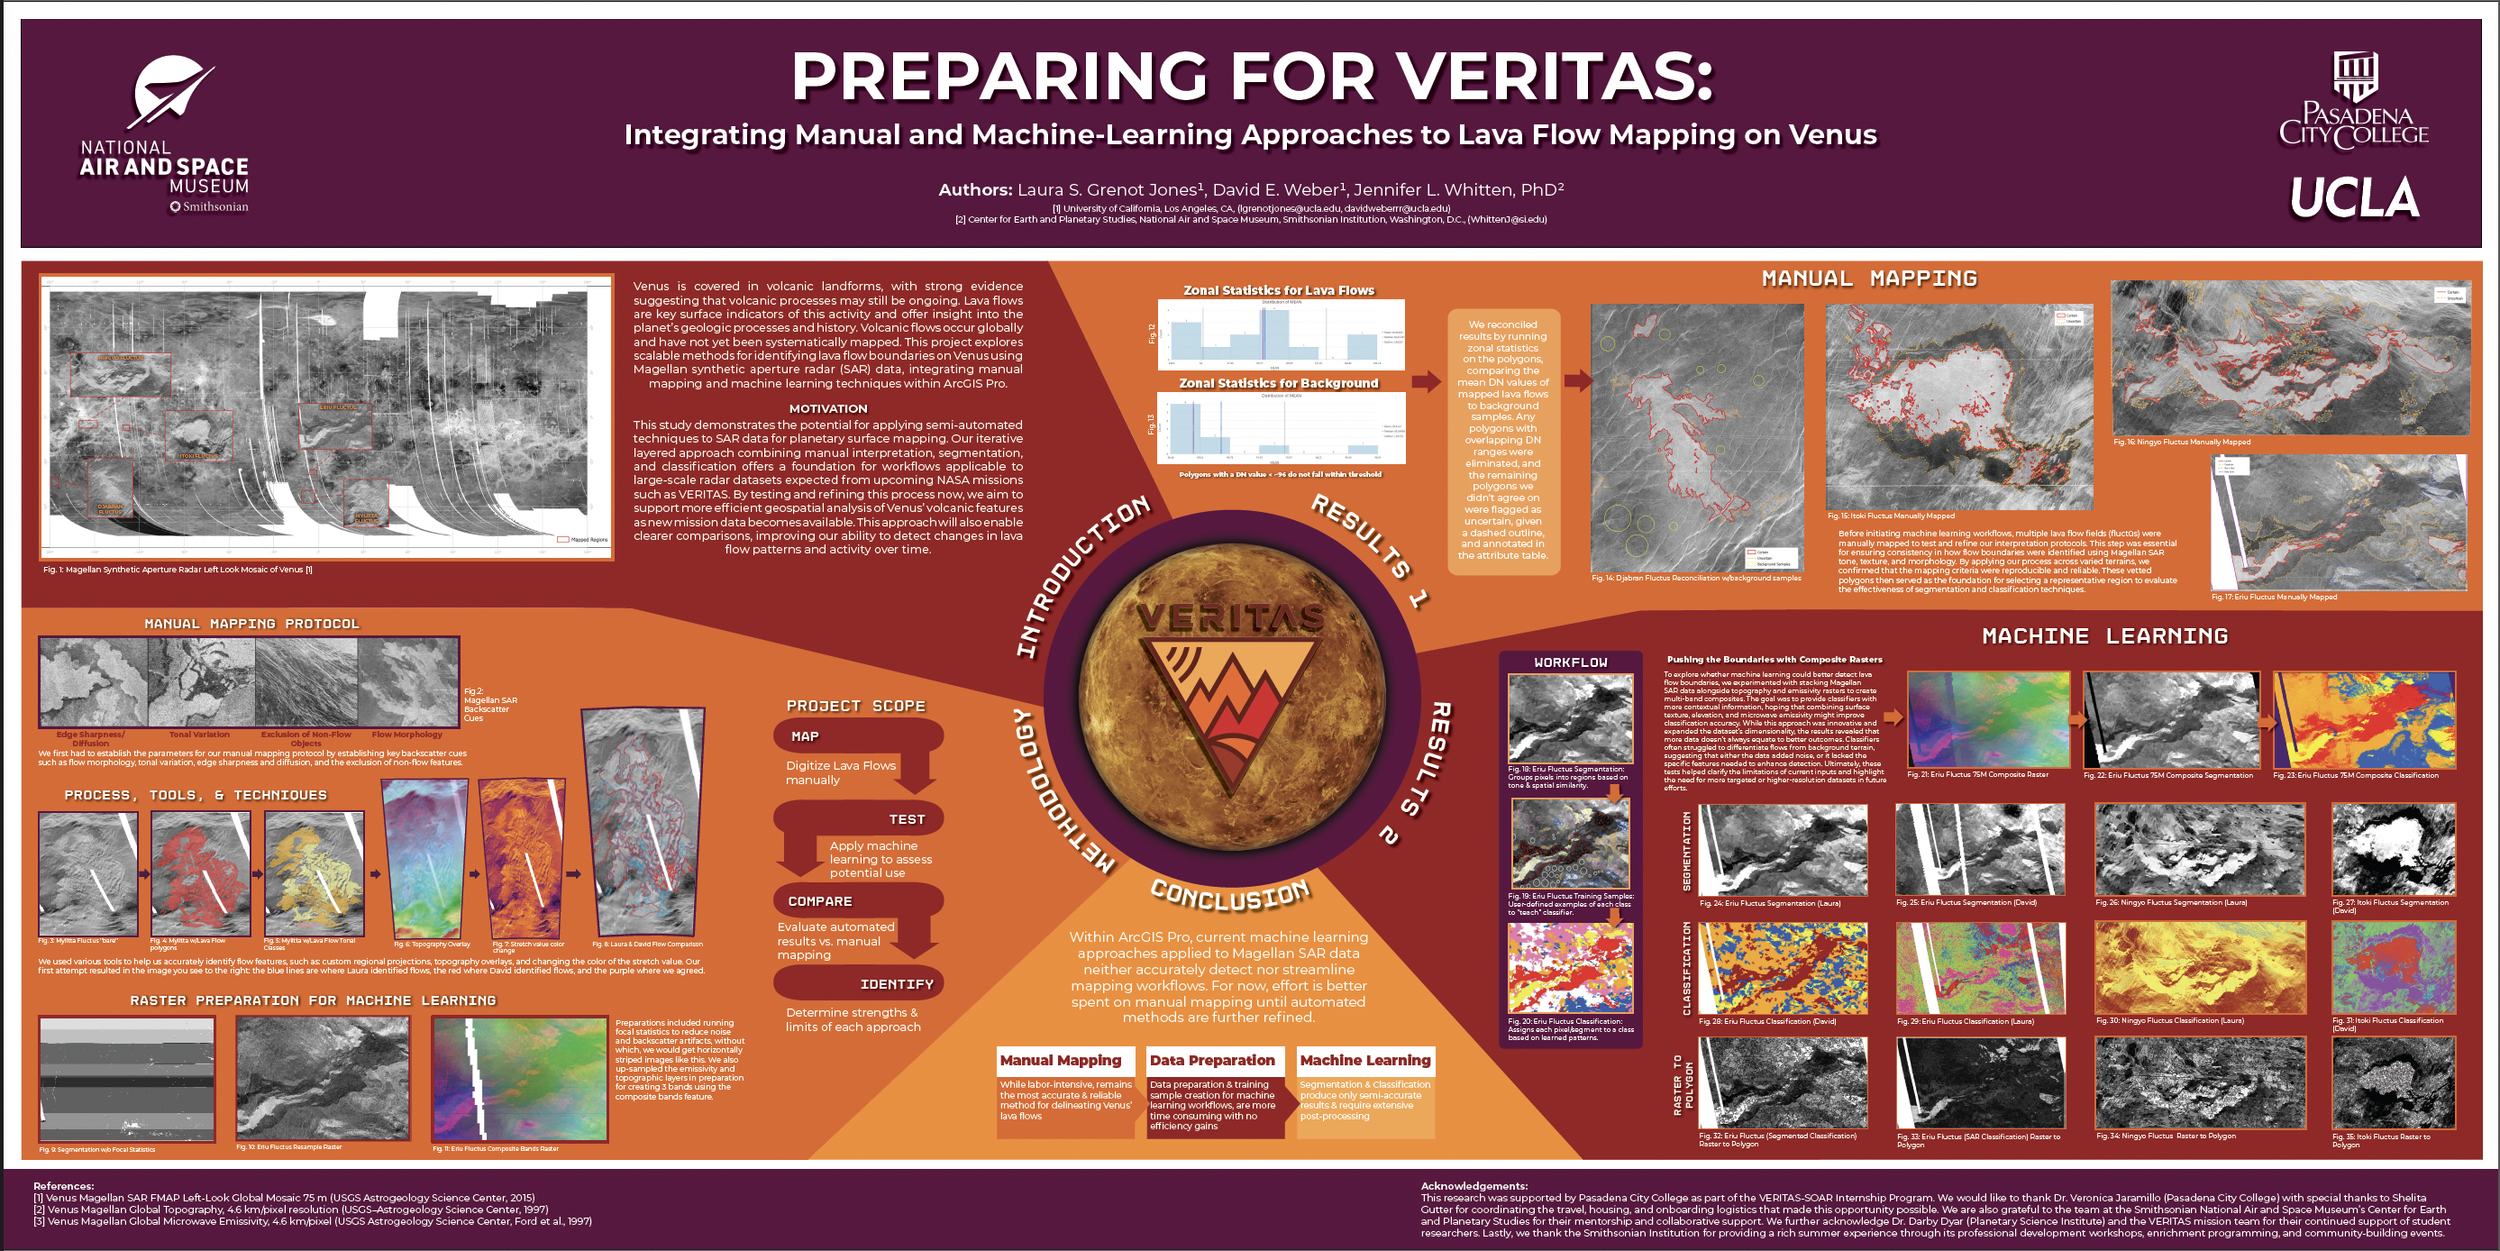
Mapping Lava Flows on Venus
My interest in planetary mapping grew out of a long-standing curiosity about landscapes, how they form, how they change, and how much information is embedded in their textures and patterns. This project gave me the opportunity to apply geologic reasoning and cartographic design principles to a planetary surface very different from Earth, using Magellan synthetic aperture radar (SAR) data to map lava flows on Venus as part of my VERITAS/SOAR summer internship at the National Air and Space Museum.
Working within ArcGIS Pro, I explored how lava flow boundaries can be identified using radar backscatter cues such as tonal variation, morphology, and edge sharpness. I developed a detailed manual digitization workflow and then tested whether semi-automated machine learning approaches could meaningfully support or streamline the mapping process. By comparing manual maps with segmentation and classification outputs, I evaluated not just efficiency, but cartographic reliability: how clearly and consistently the resulting maps represented Venus’ volcanic features.
What stood out most to me through this work was the importance of careful human interpretation when working with complex planetary radar data. While automated methods showed promise, manual mapping remained the most accurate and interpretable approach at this stage. This project reinforced my interest in planetary cartography as both a technical and interpretive practice, and in understanding where automation can assist mapping, and where it can obscure important geologic signals.
This work was completed in support of future Venus missions, such as NASA’s VERITAS mission, and reflects my broader interest in using GIS and cartographic design to make planetary surfaces legible, comparable, and meaningful, on worlds both familiar and distant.
*The following are selected excerpts and figures from the research posters presented at both the APCG and GSA conferences in 2025. Links to view full posters are located at the bottom of this page.
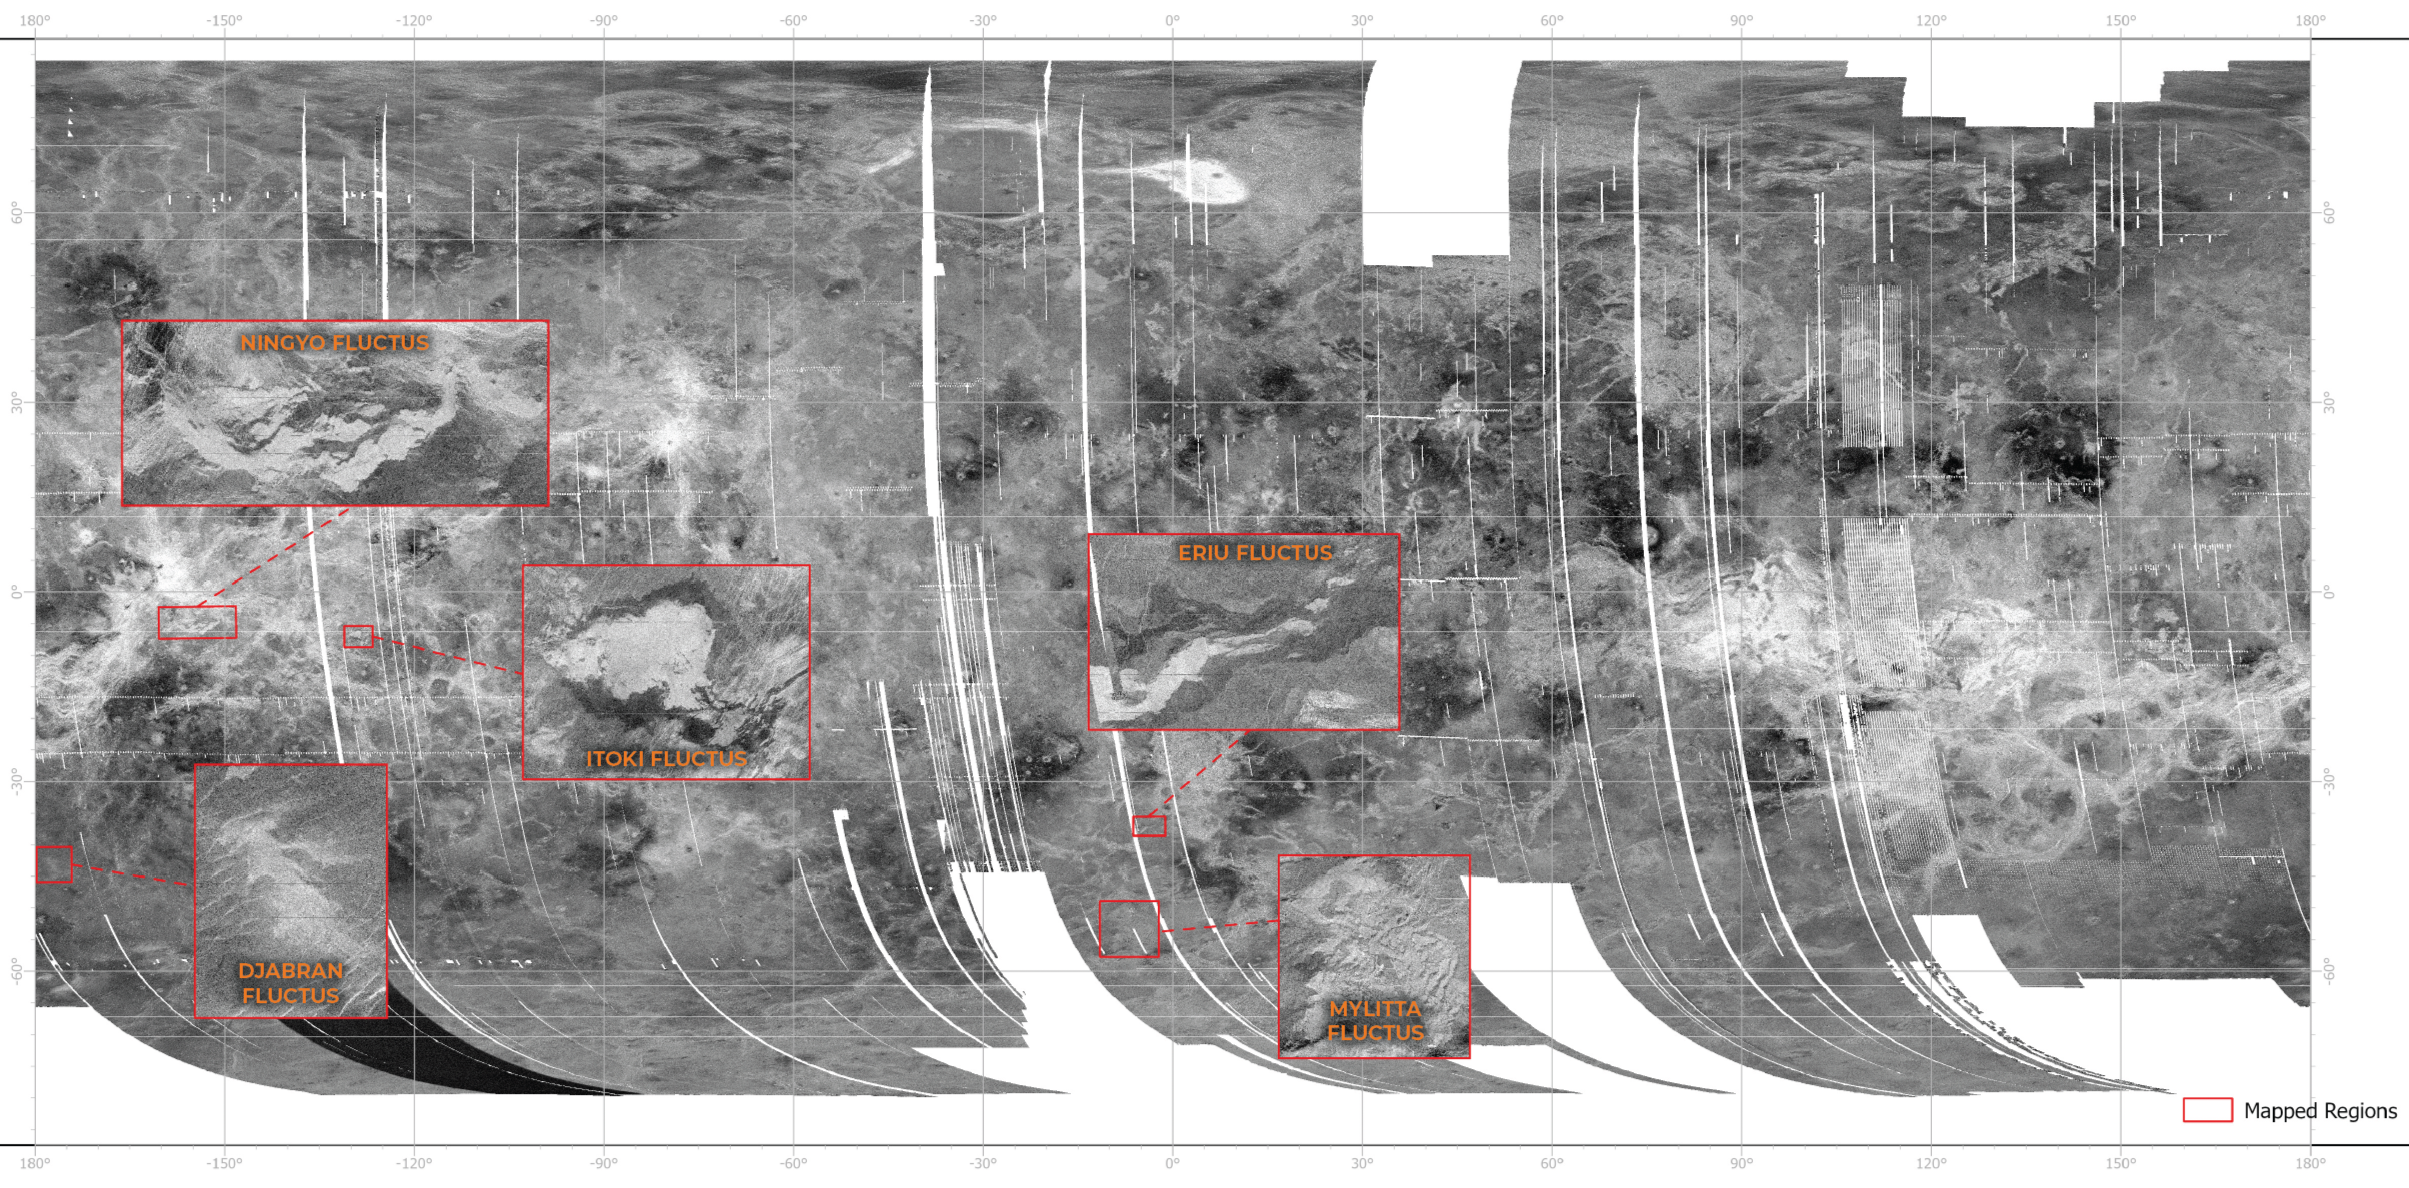
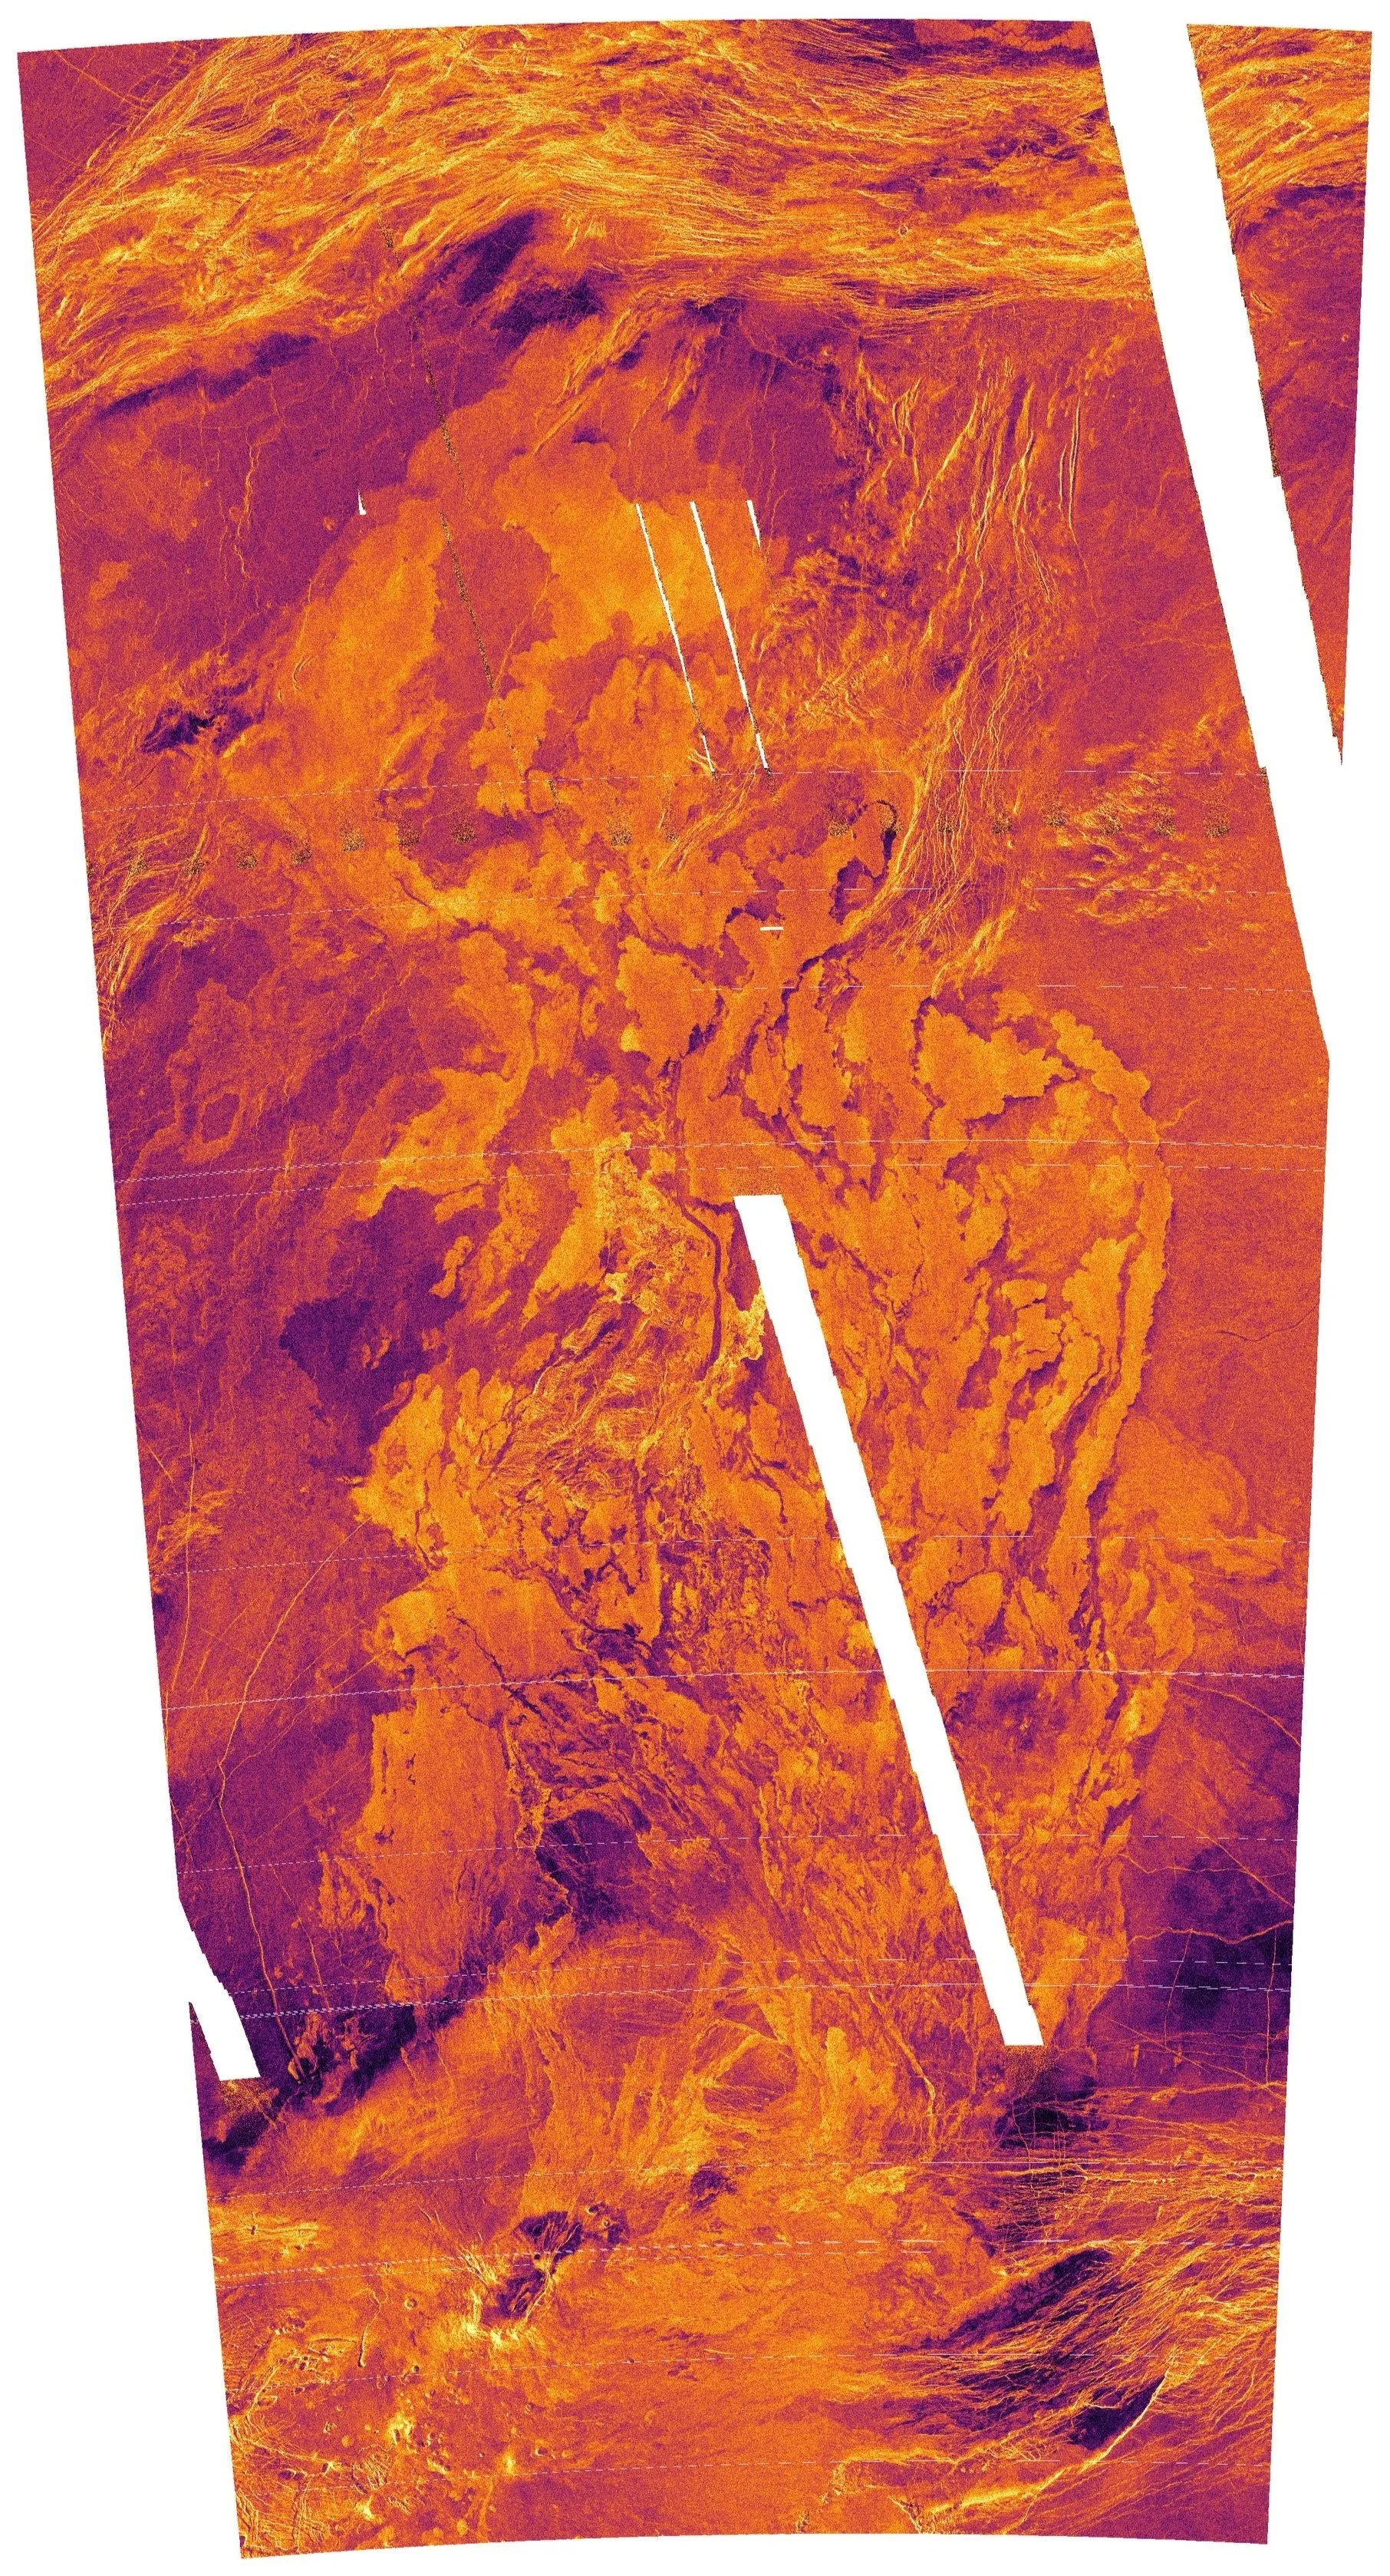
Fig. 1: Magellan Synthetic Aperture Radar Left Look Mosaic of Venus
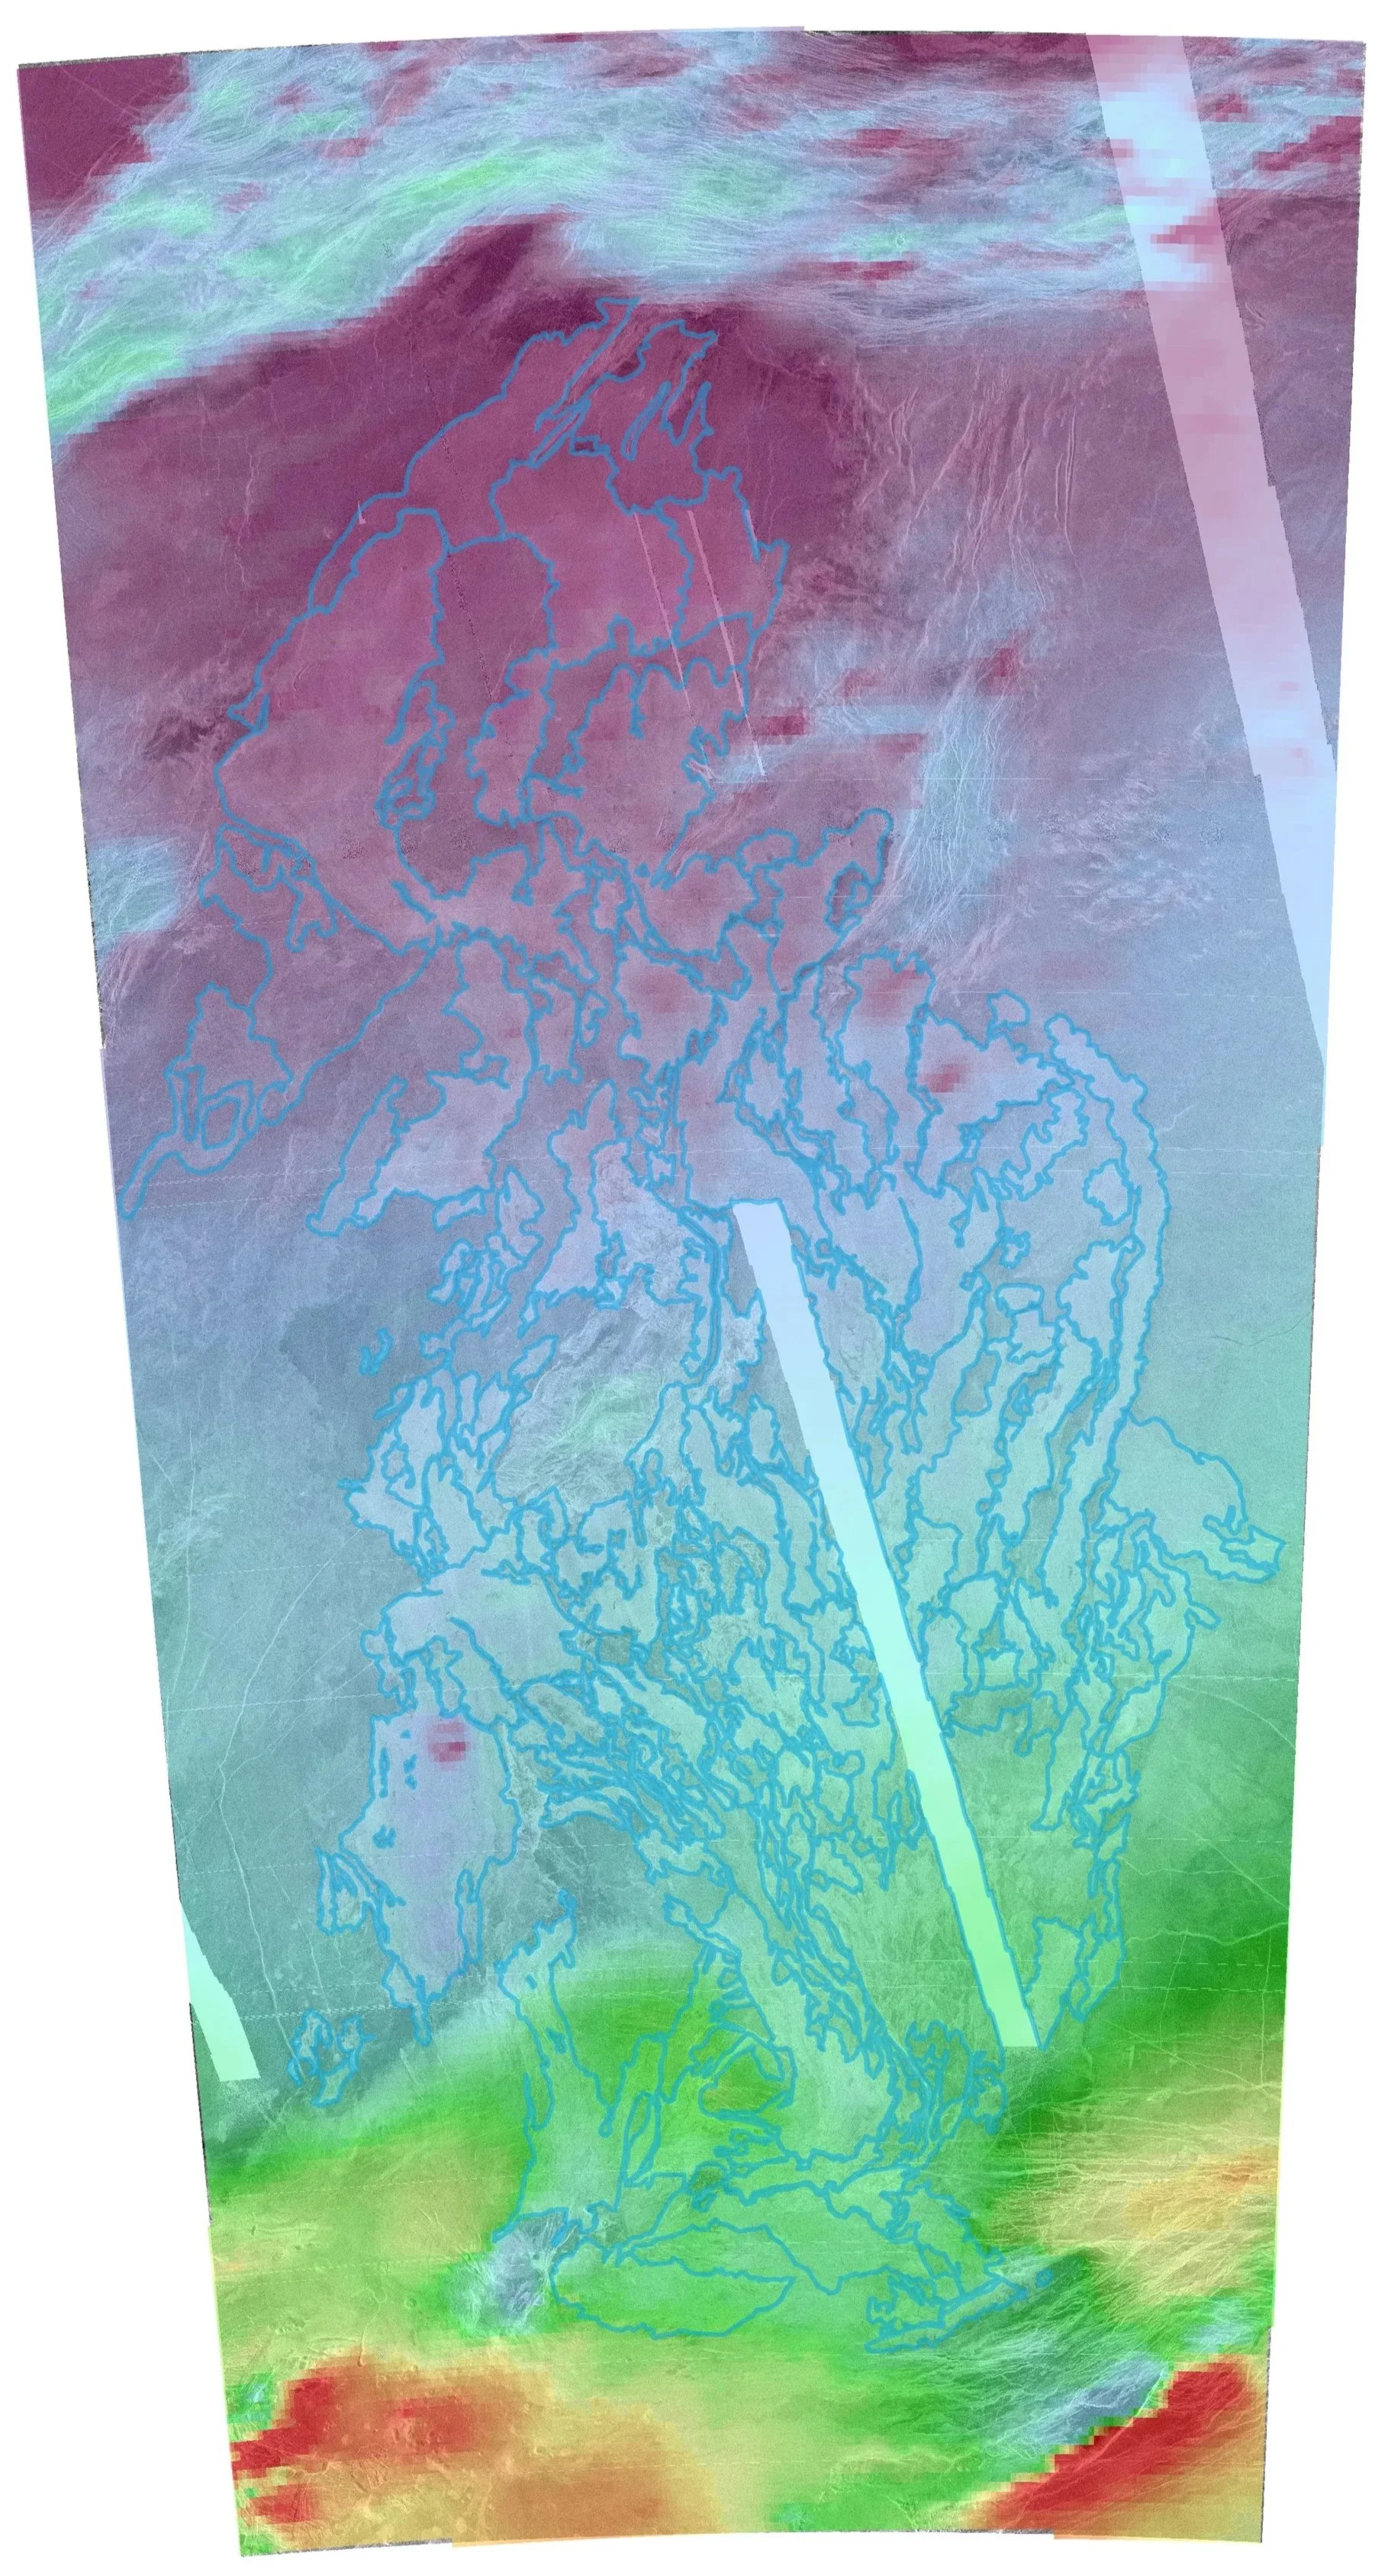
Fig. 6: Mylitta Fluctus w/Magellan Topography Overlay
We first had to establish the parameters for our manual mapping protocol by establishing key backscatter cues such as flow morphology, tonal variation, edge sharpness and diffusion, and the exclusion of non-flow features.
We used various tools to help us accurately identify flow features, such as: custom regional projections, topography overlays, and changing the color of the stretch value. Our first attempt resulted in the image you see to the right: the blue lines are where Laura identified flows, the red where David identified flows, and the purple where we agreed.
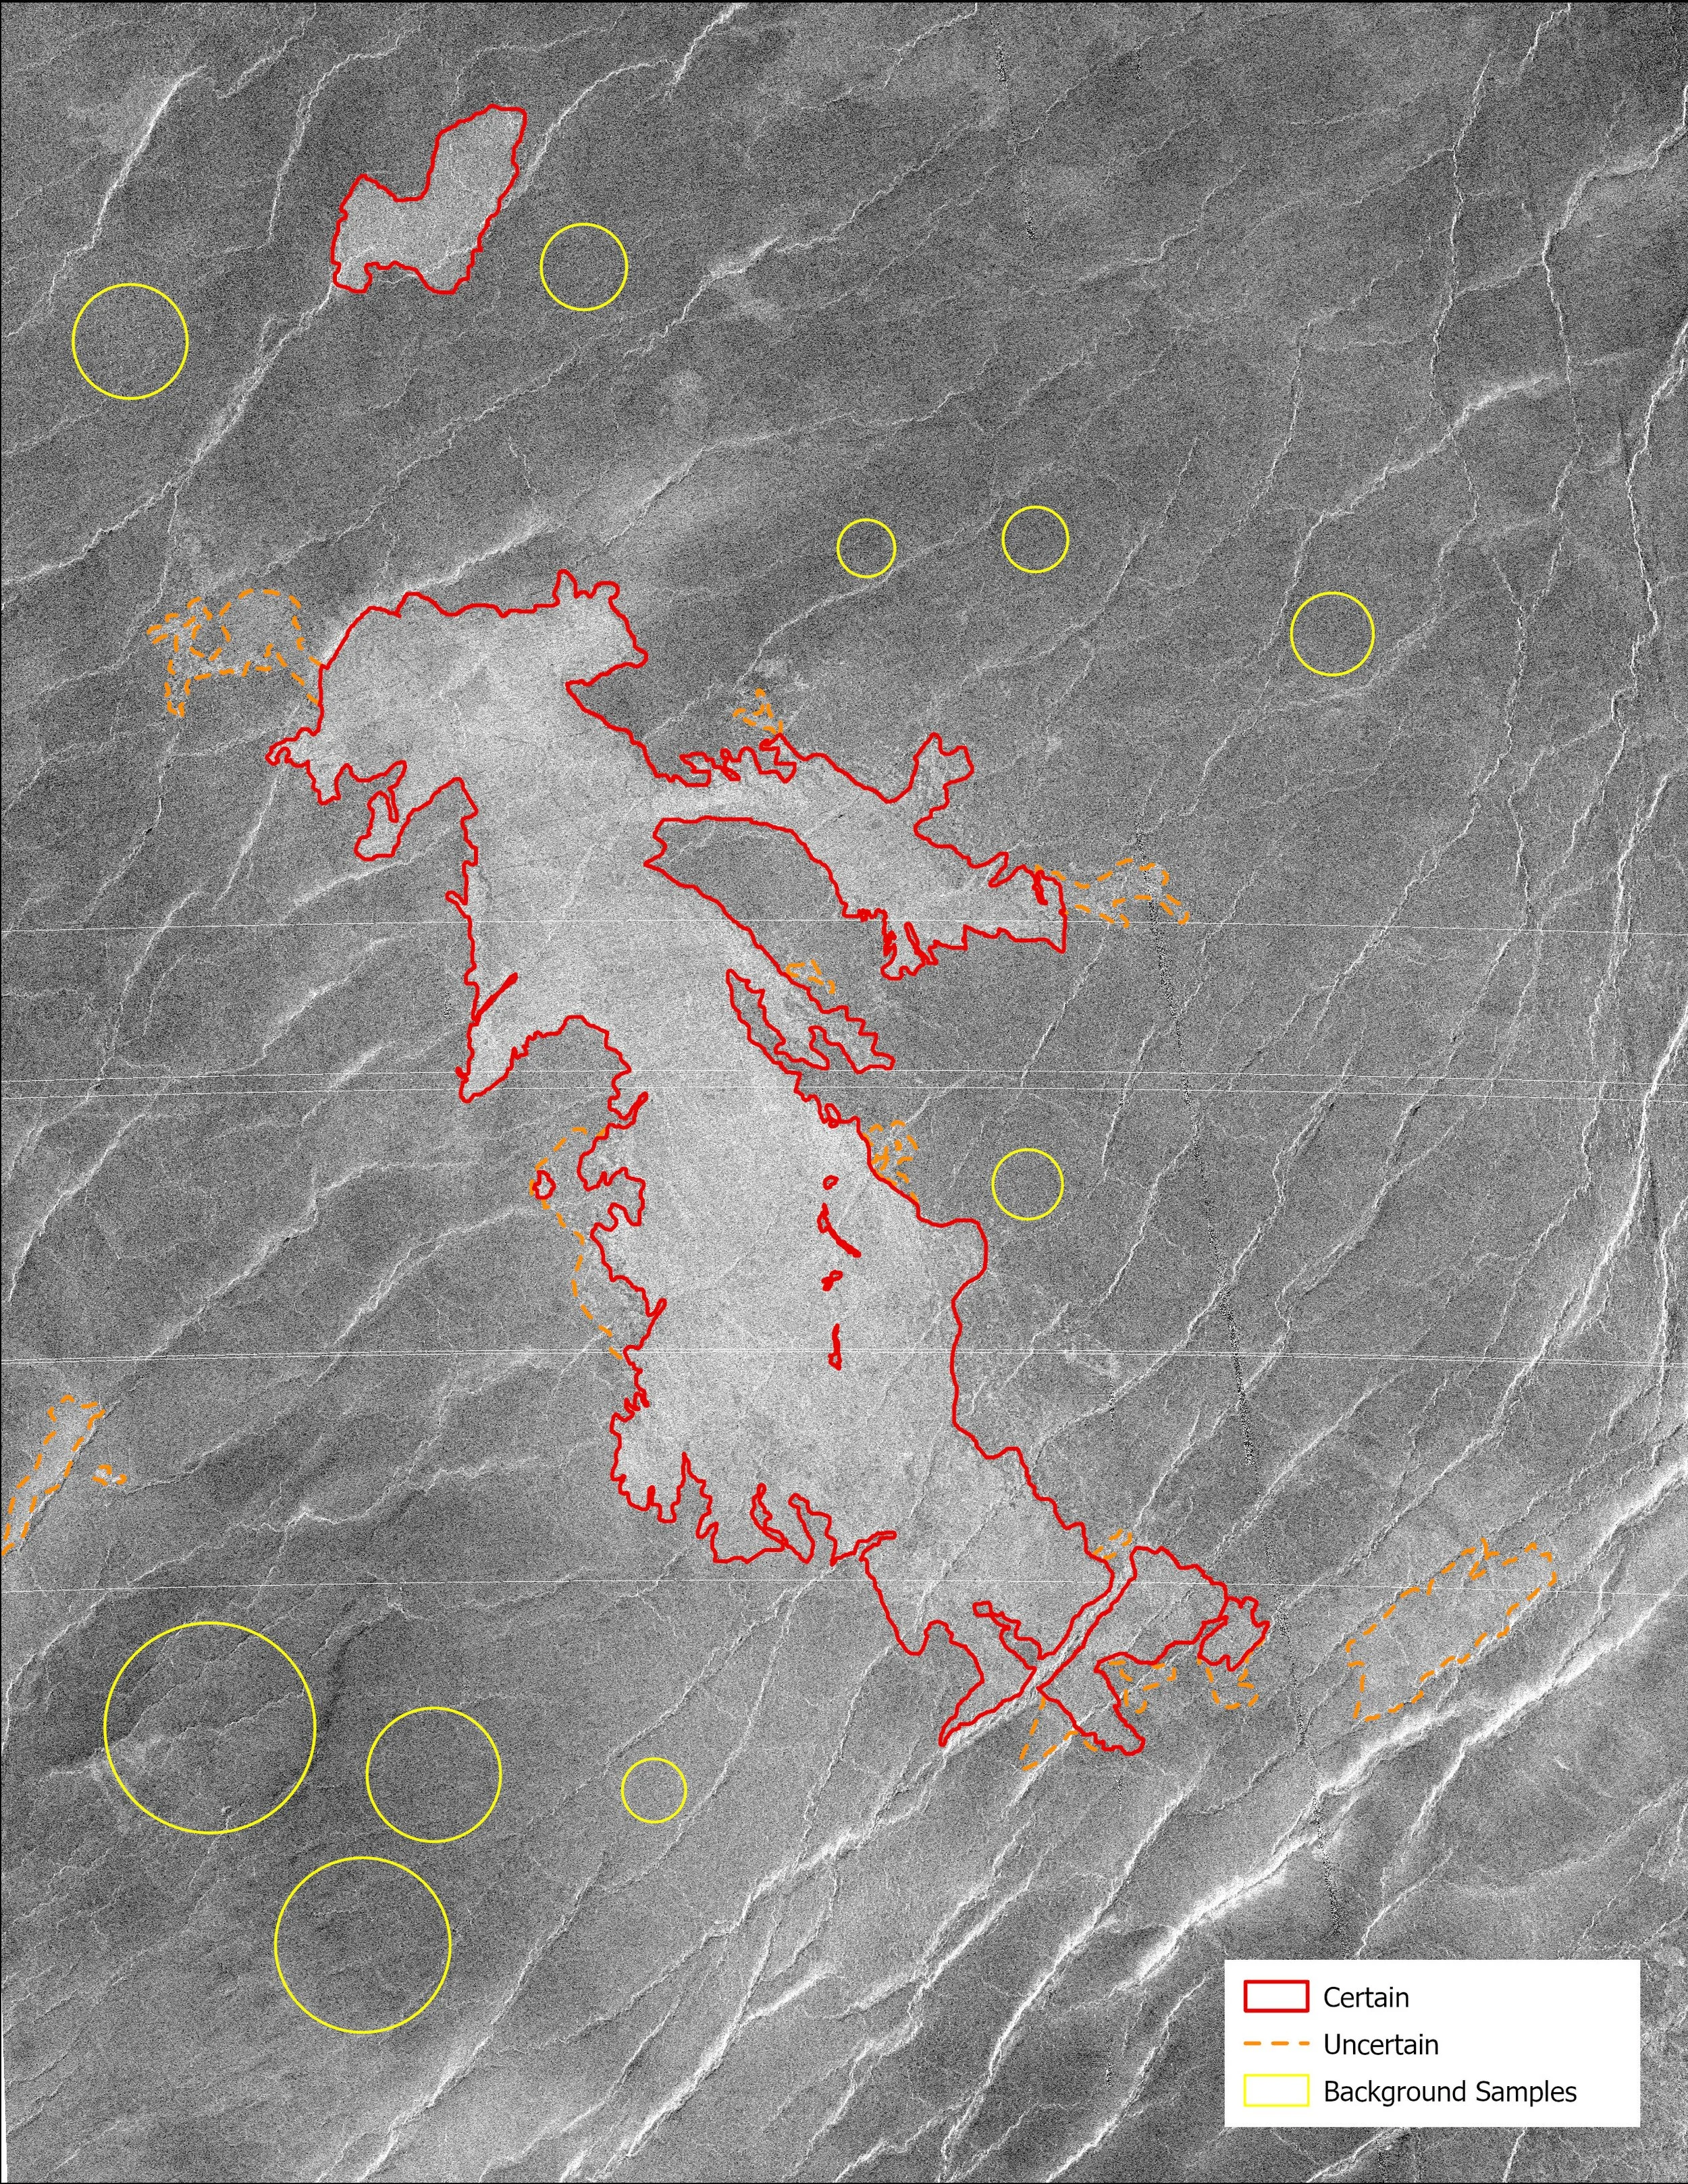
Fig. 14: Djabran Fluctus Reconciliation w/background samples
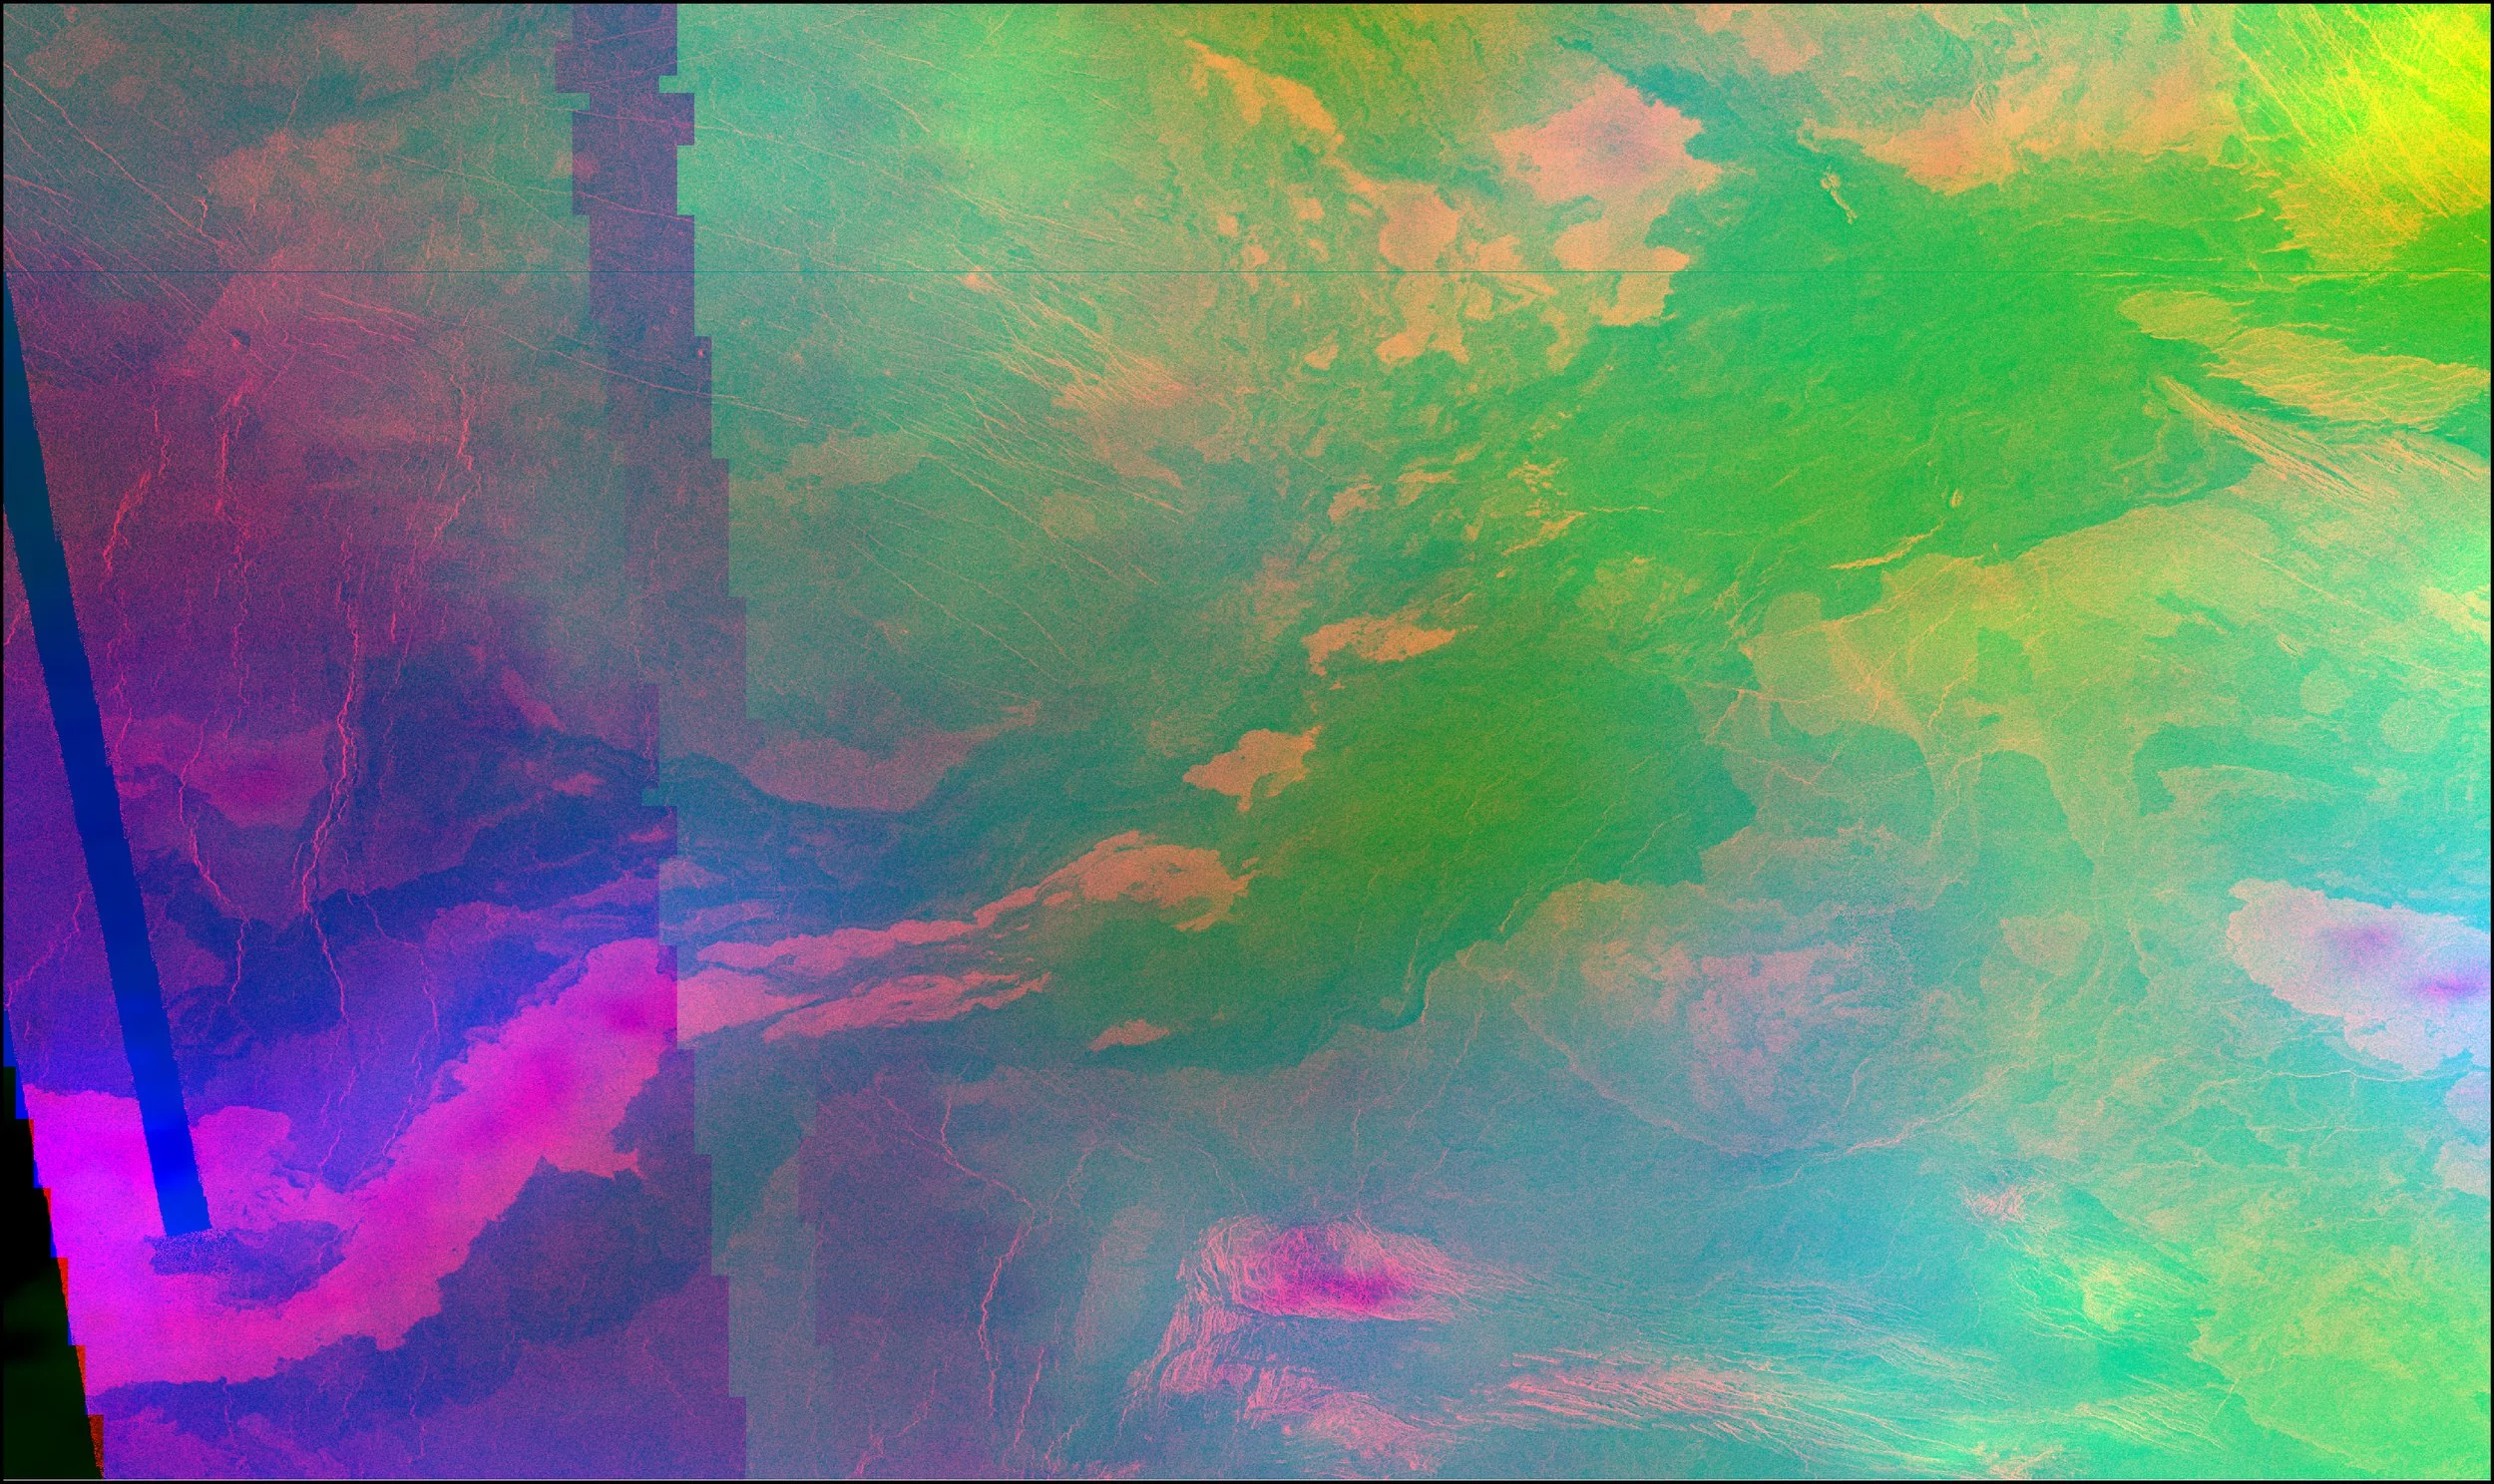
Fig. 21: Eriu Fluctus 75M Composite Raster
Project Scope
Tools for Manual Mapping
Composite Rasters for Machine Learning
To explore whether machine learning could better detect lava flow boundaries, we experimented with stacking Magellan SAR data alongside topography and emissivity rasters to create multi-band composites. The goal was to provide classifiers with more contextual information, hoping that combining surface texture, elevation, and microwave emissivity might improve classification accuracy. While this approach was innovative and expanded the dataset’s dimensionality, the results revealed that more data doesn’t always equate to better outcomes. Classifiers often struggled to differentiate flows from background terrain, suggesting that either the data added noise, or it lacked the specific features needed to enhance detection. Ultimately, these tests helped clarify the limitations of current inputs and highlight the need for more targeted or higher-resolution datasets in future efforts.
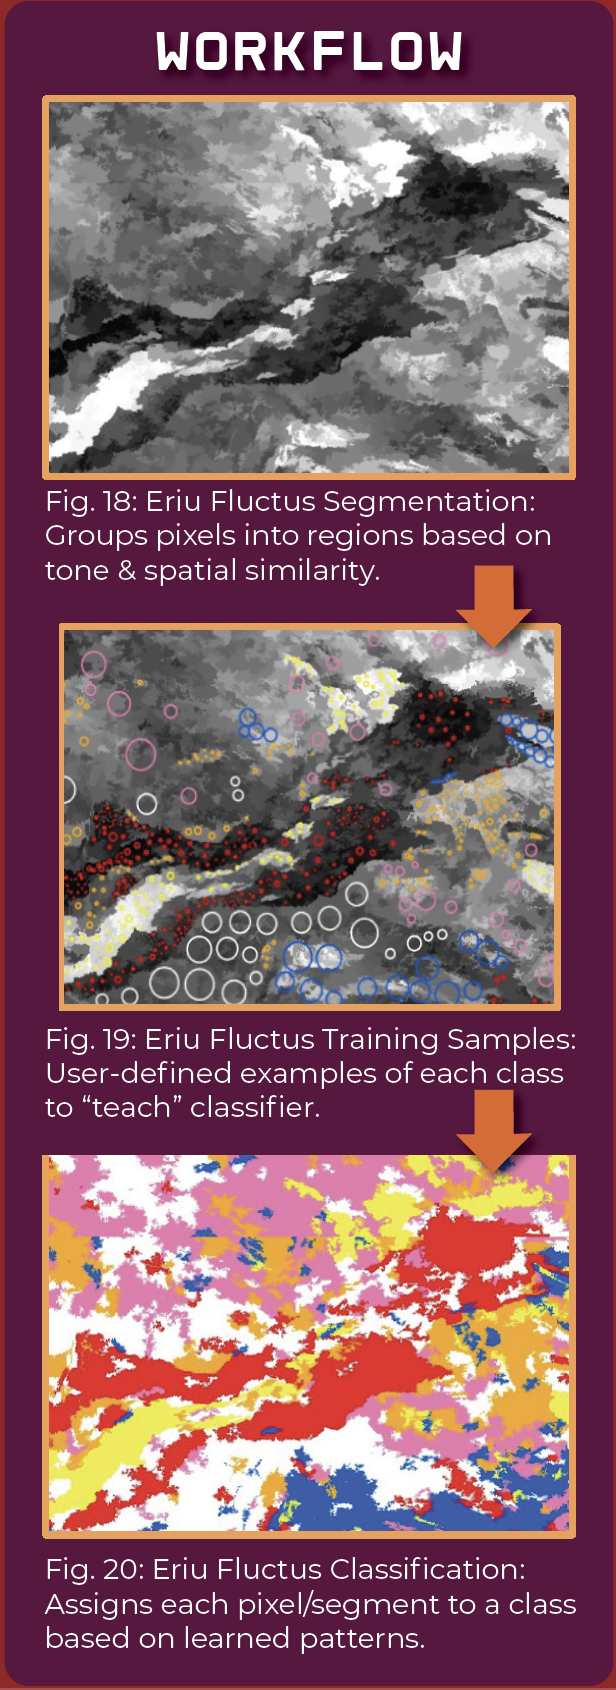
Fig. 7: Mylitta Fluctus w/Stretch Value color change
Fig. 16: Ningyo Fluctus Manually Mapped
Why This Matters
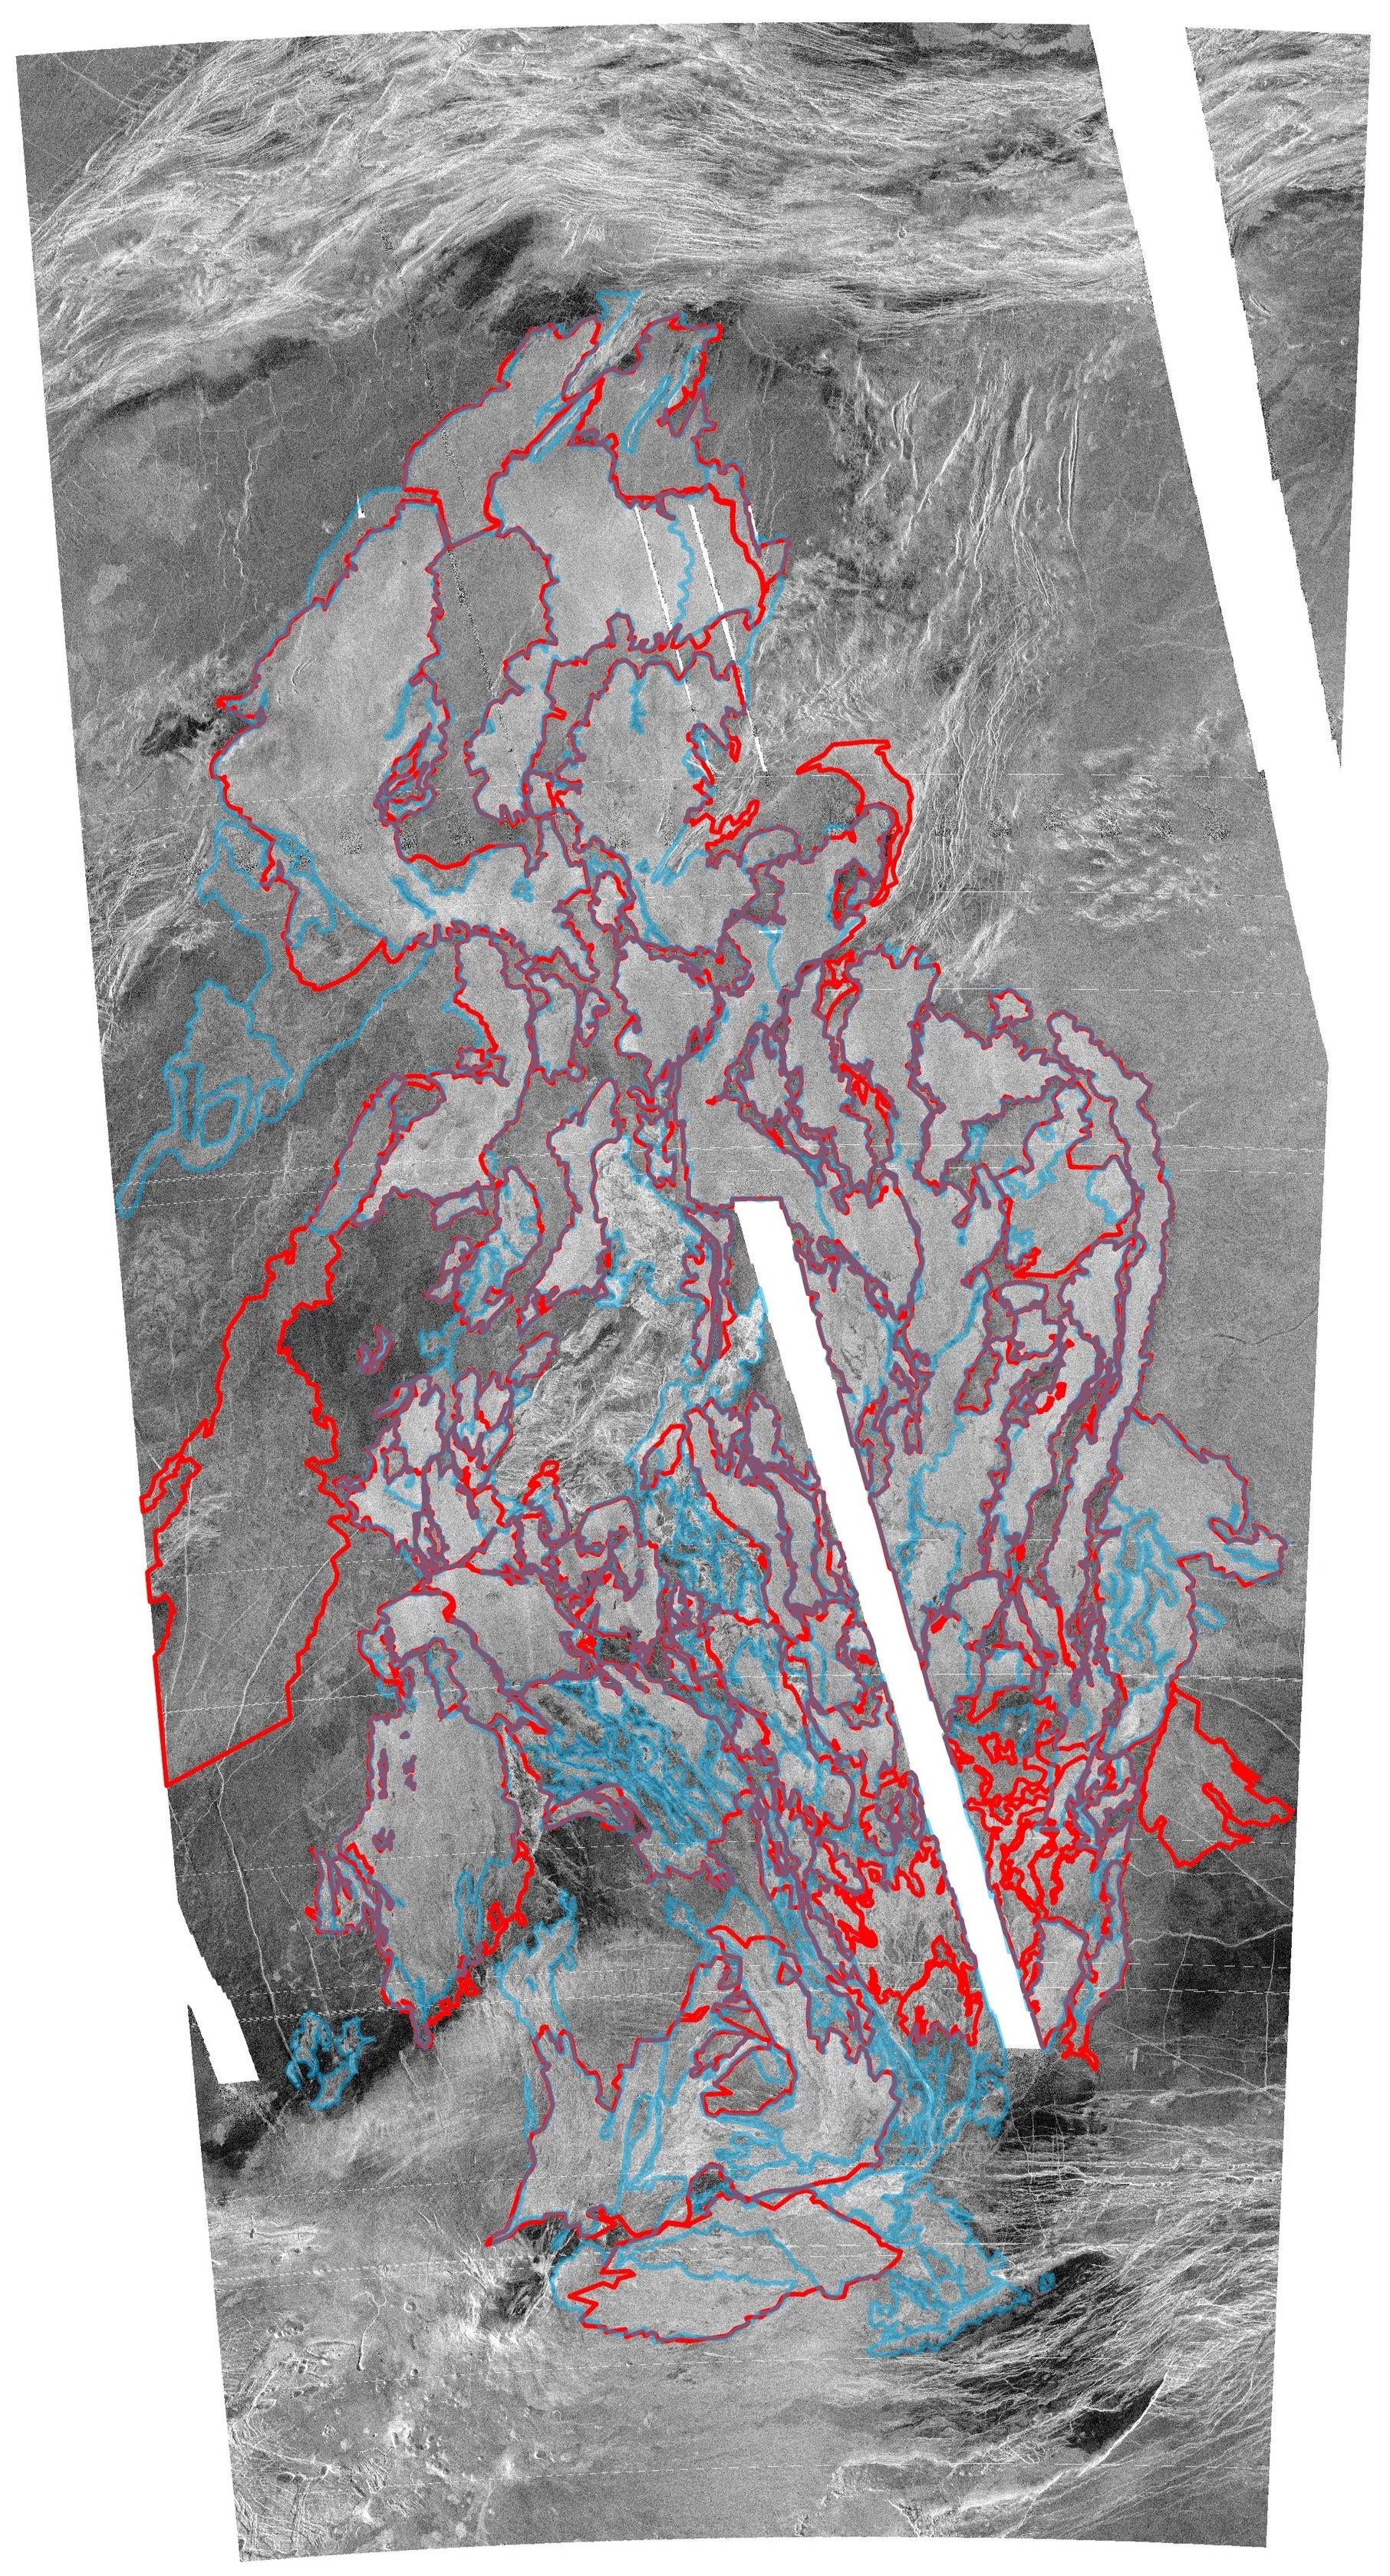
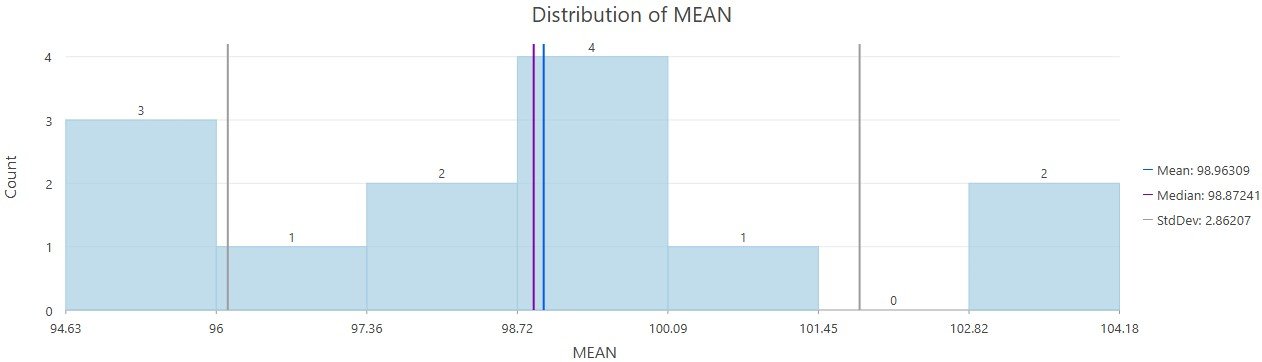
Fig. 12: Zonal Statistics Histogram for Lava Flows
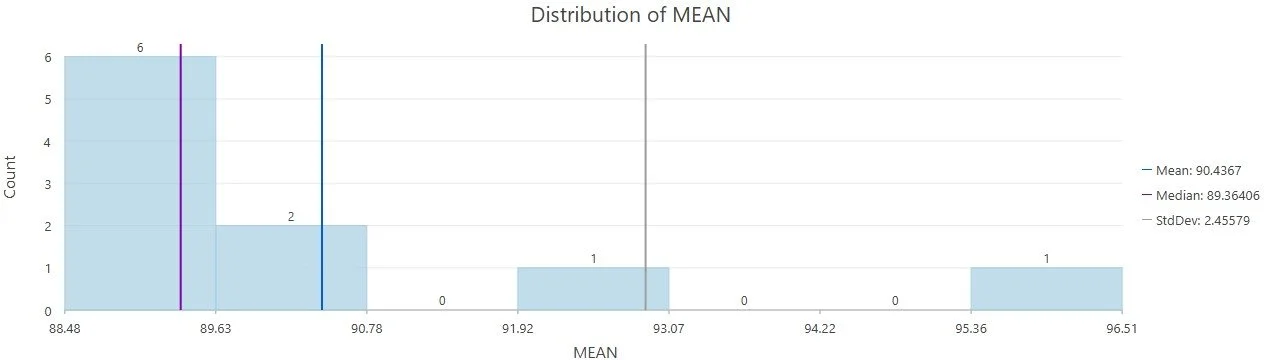
Fig. 13: Zonal Statistics Histogram for Background Samples
We reconciled results by running zonal statistics on the polygons, comparing the mean DN values of mapped lava flows to background samples. Any polygons with overlapping DN ranges were eliminated, and the remaining polygons we didn’t agree on were flagged as uncertain, given a dashed outline, and annotated in the attribute table.
Manual Mapping
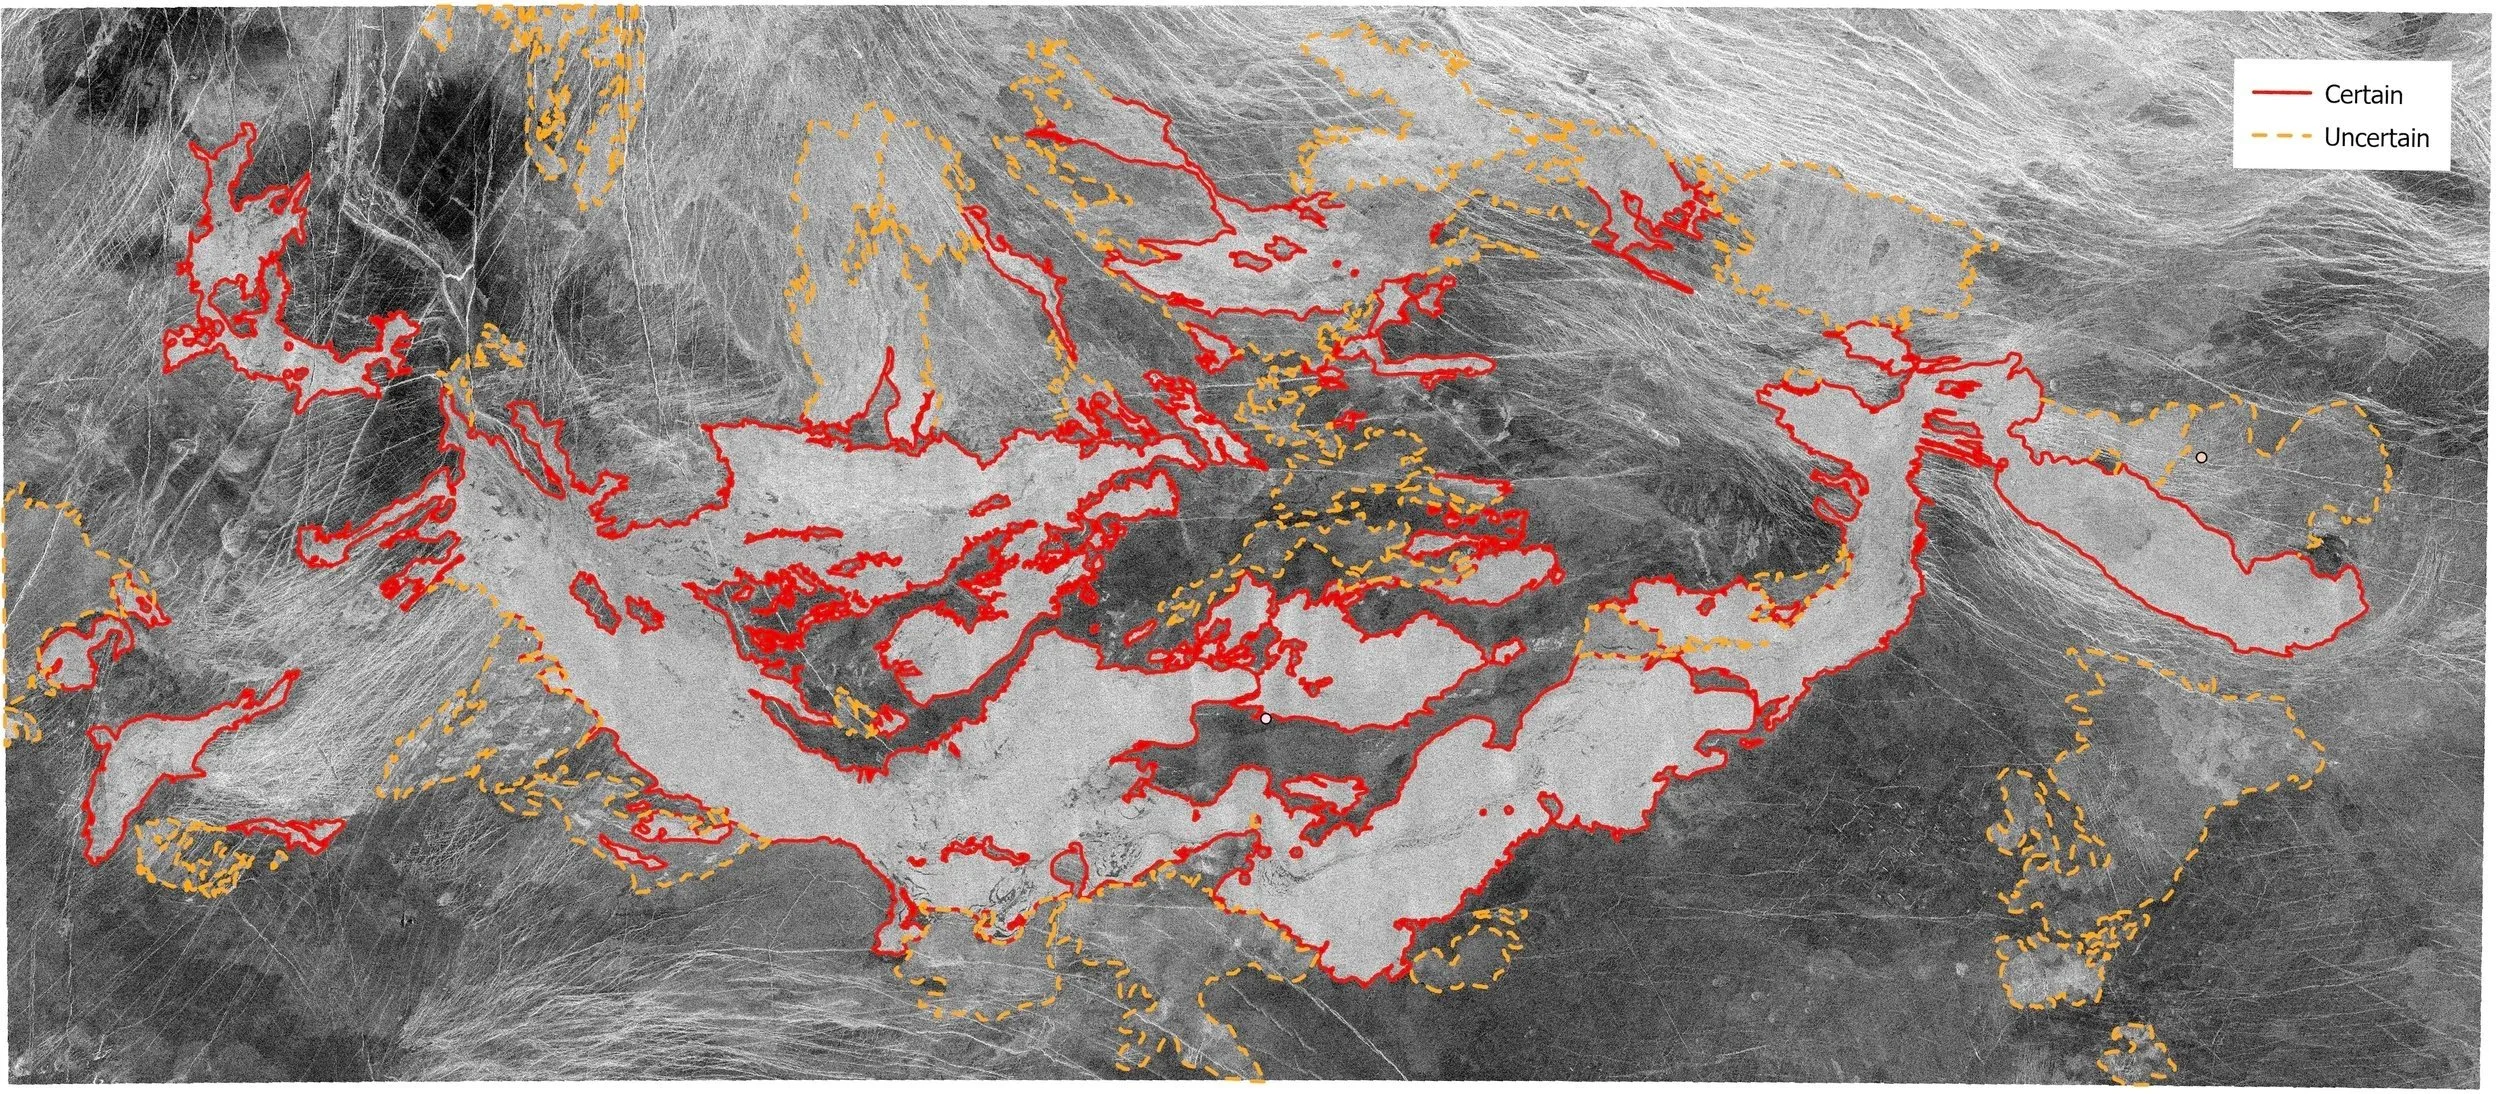
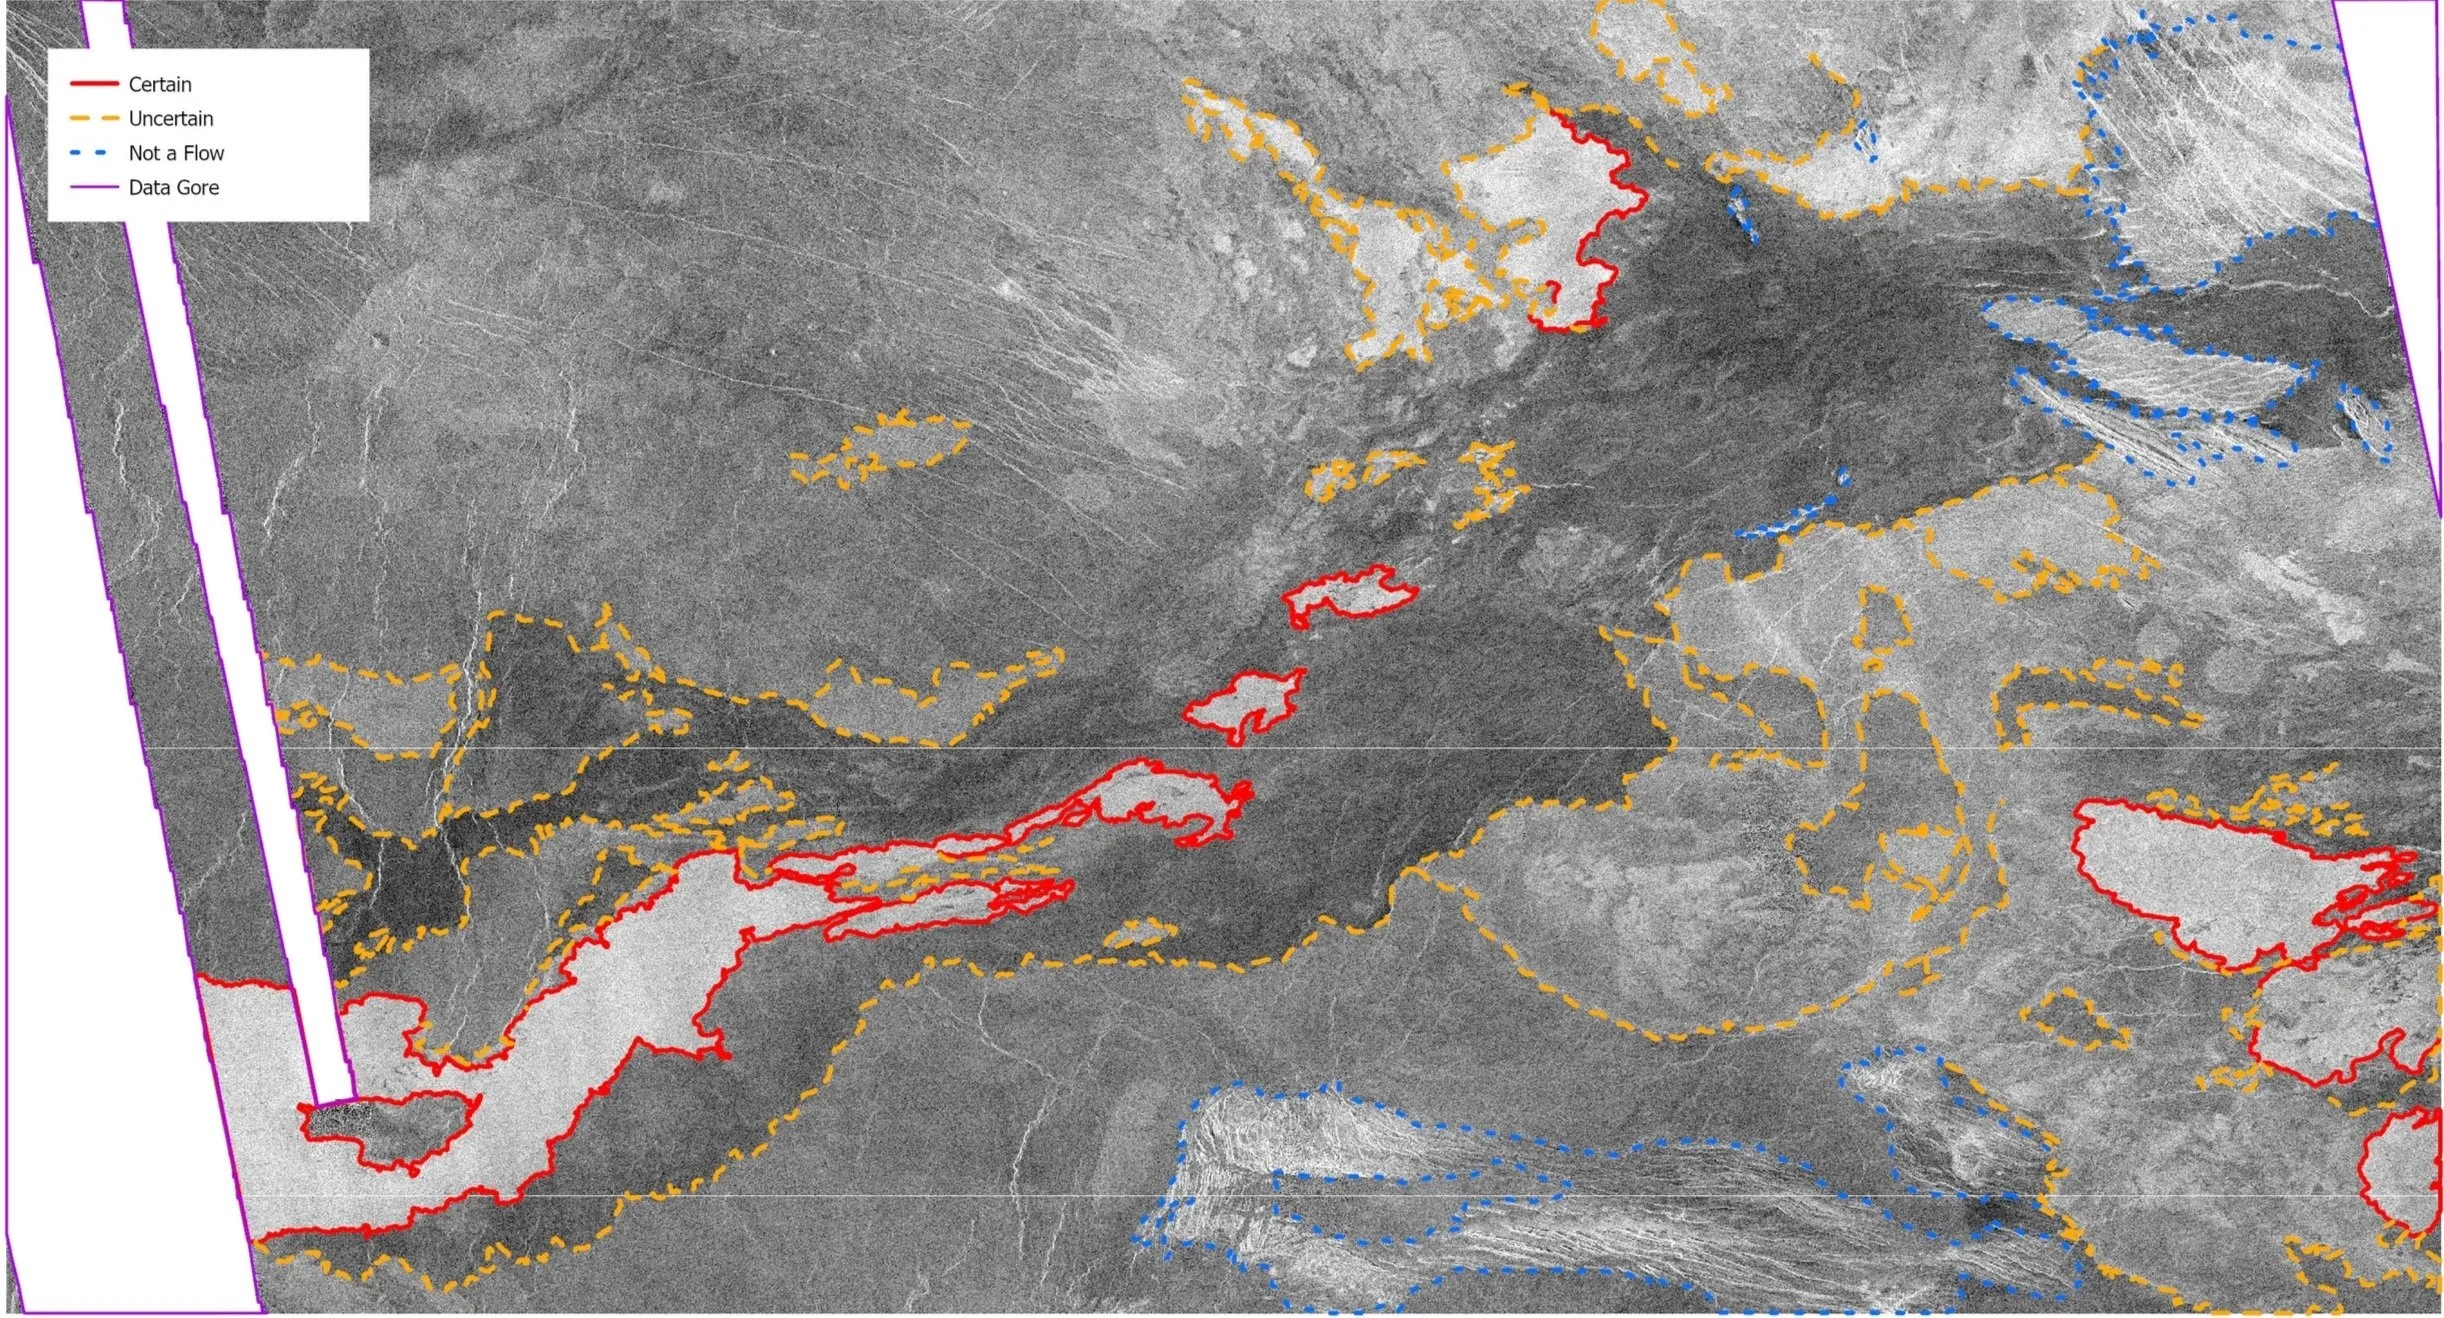
Fig. 17: Eriu Fluctus Manually Mapped w/expanded categories in preparation for machine learning
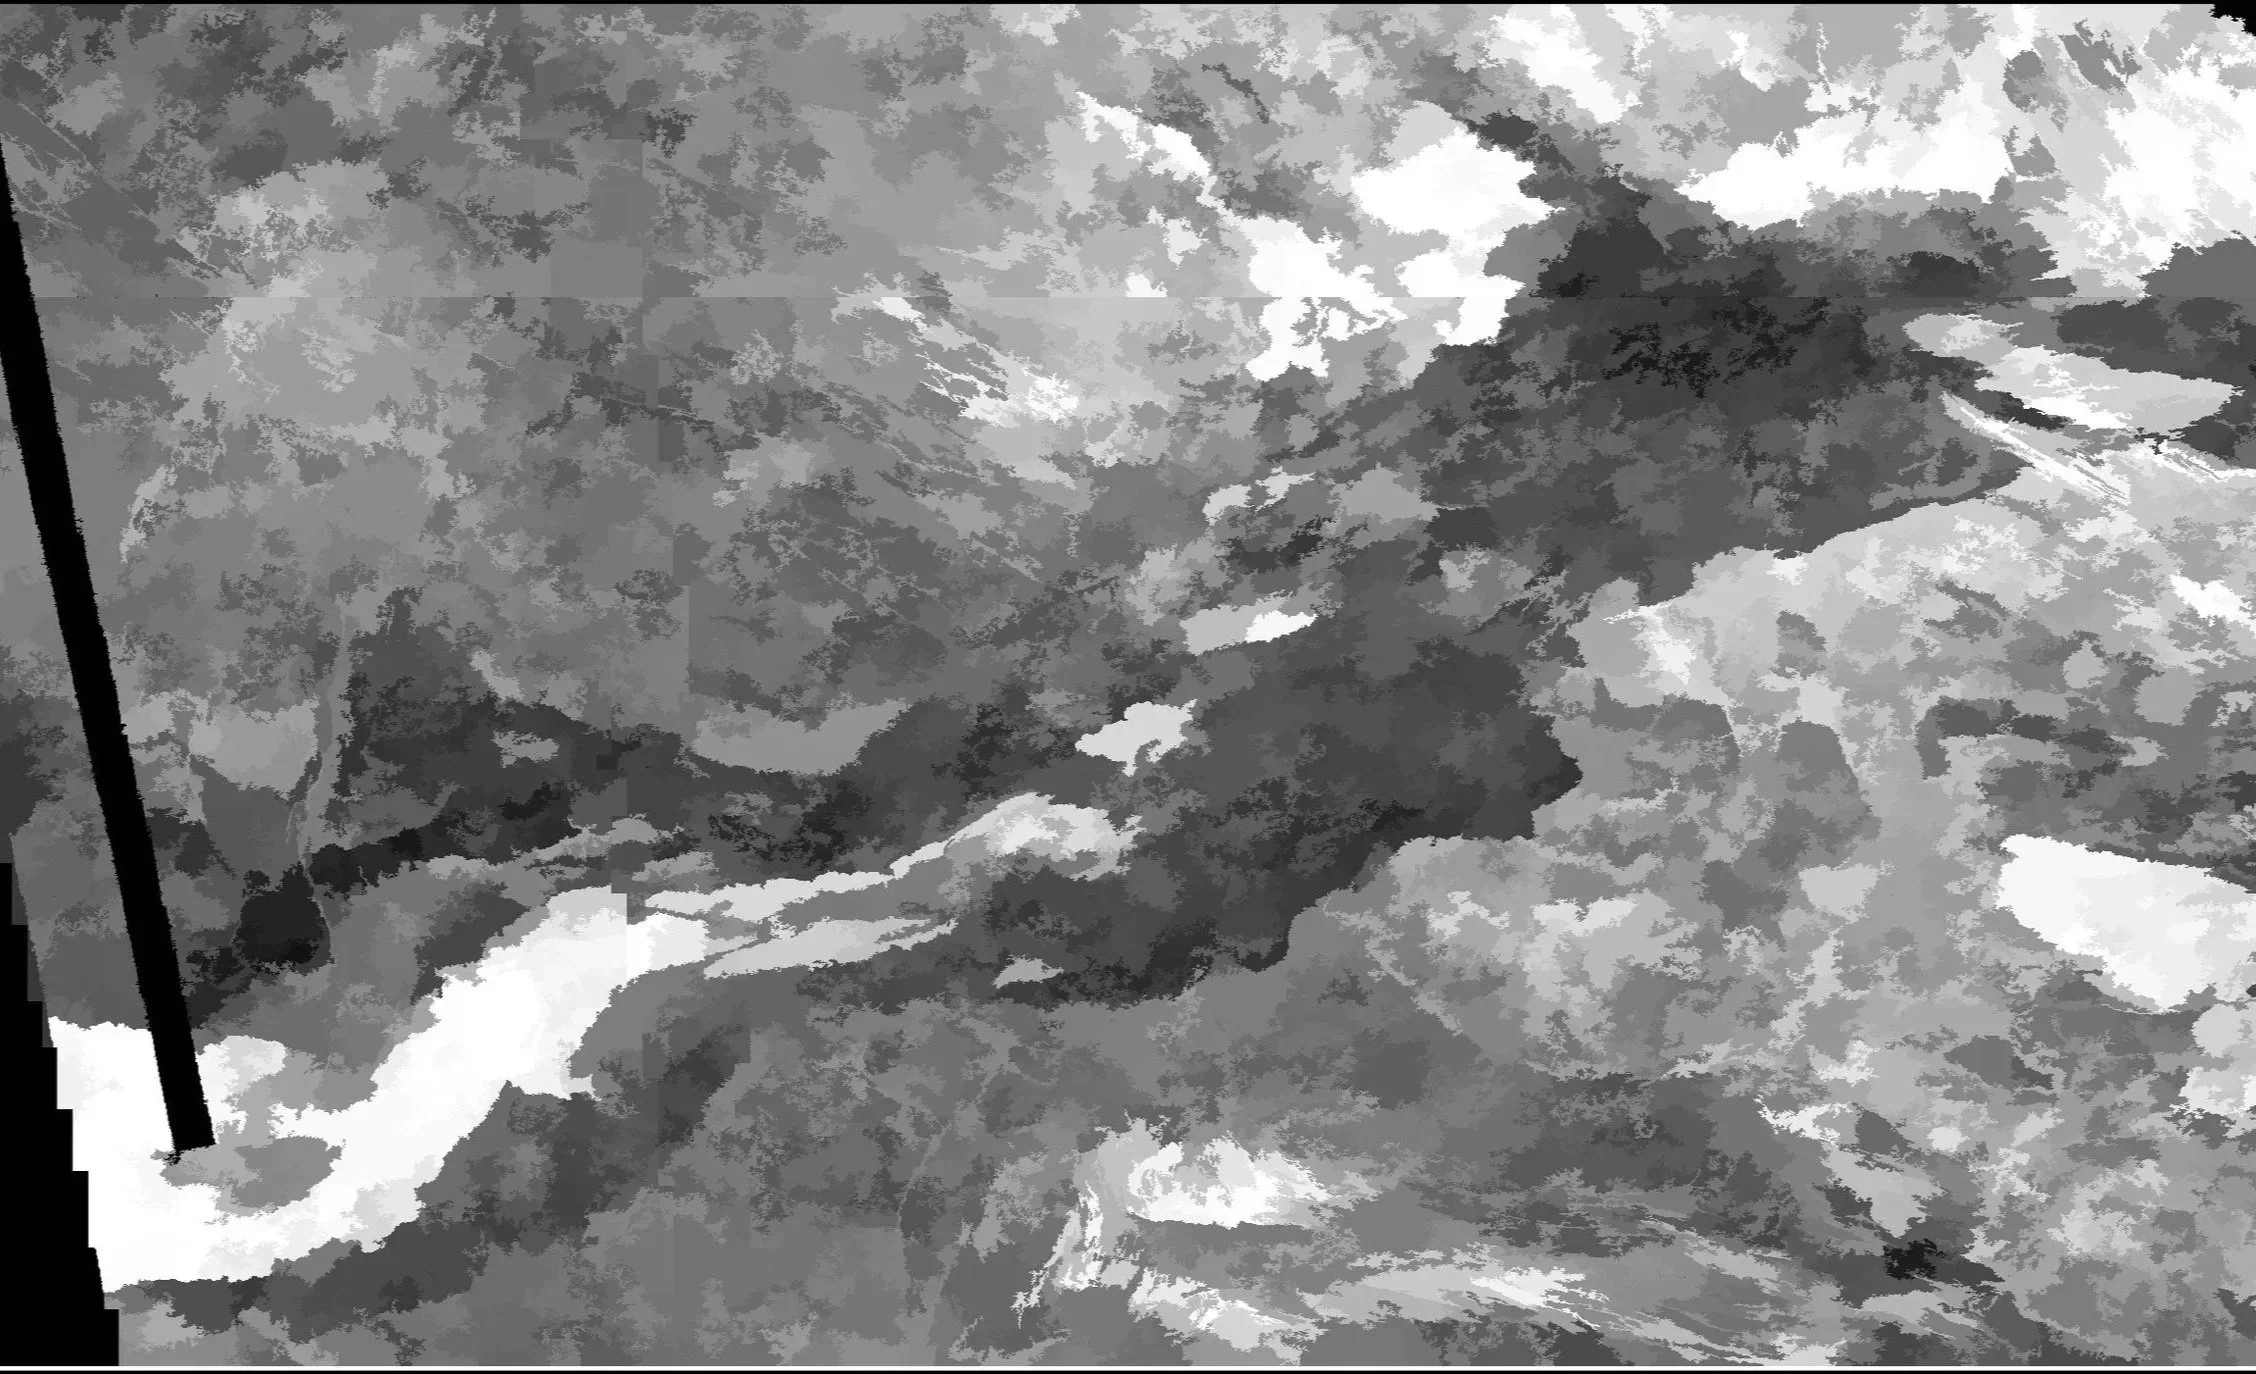
Fig. 22: Eriu Fluctus 75M Composite Segmentation
Machine Learning
Key Takeaways
Fig. 8: Mylitta Fluctus w/Laura & David Flow Comparison
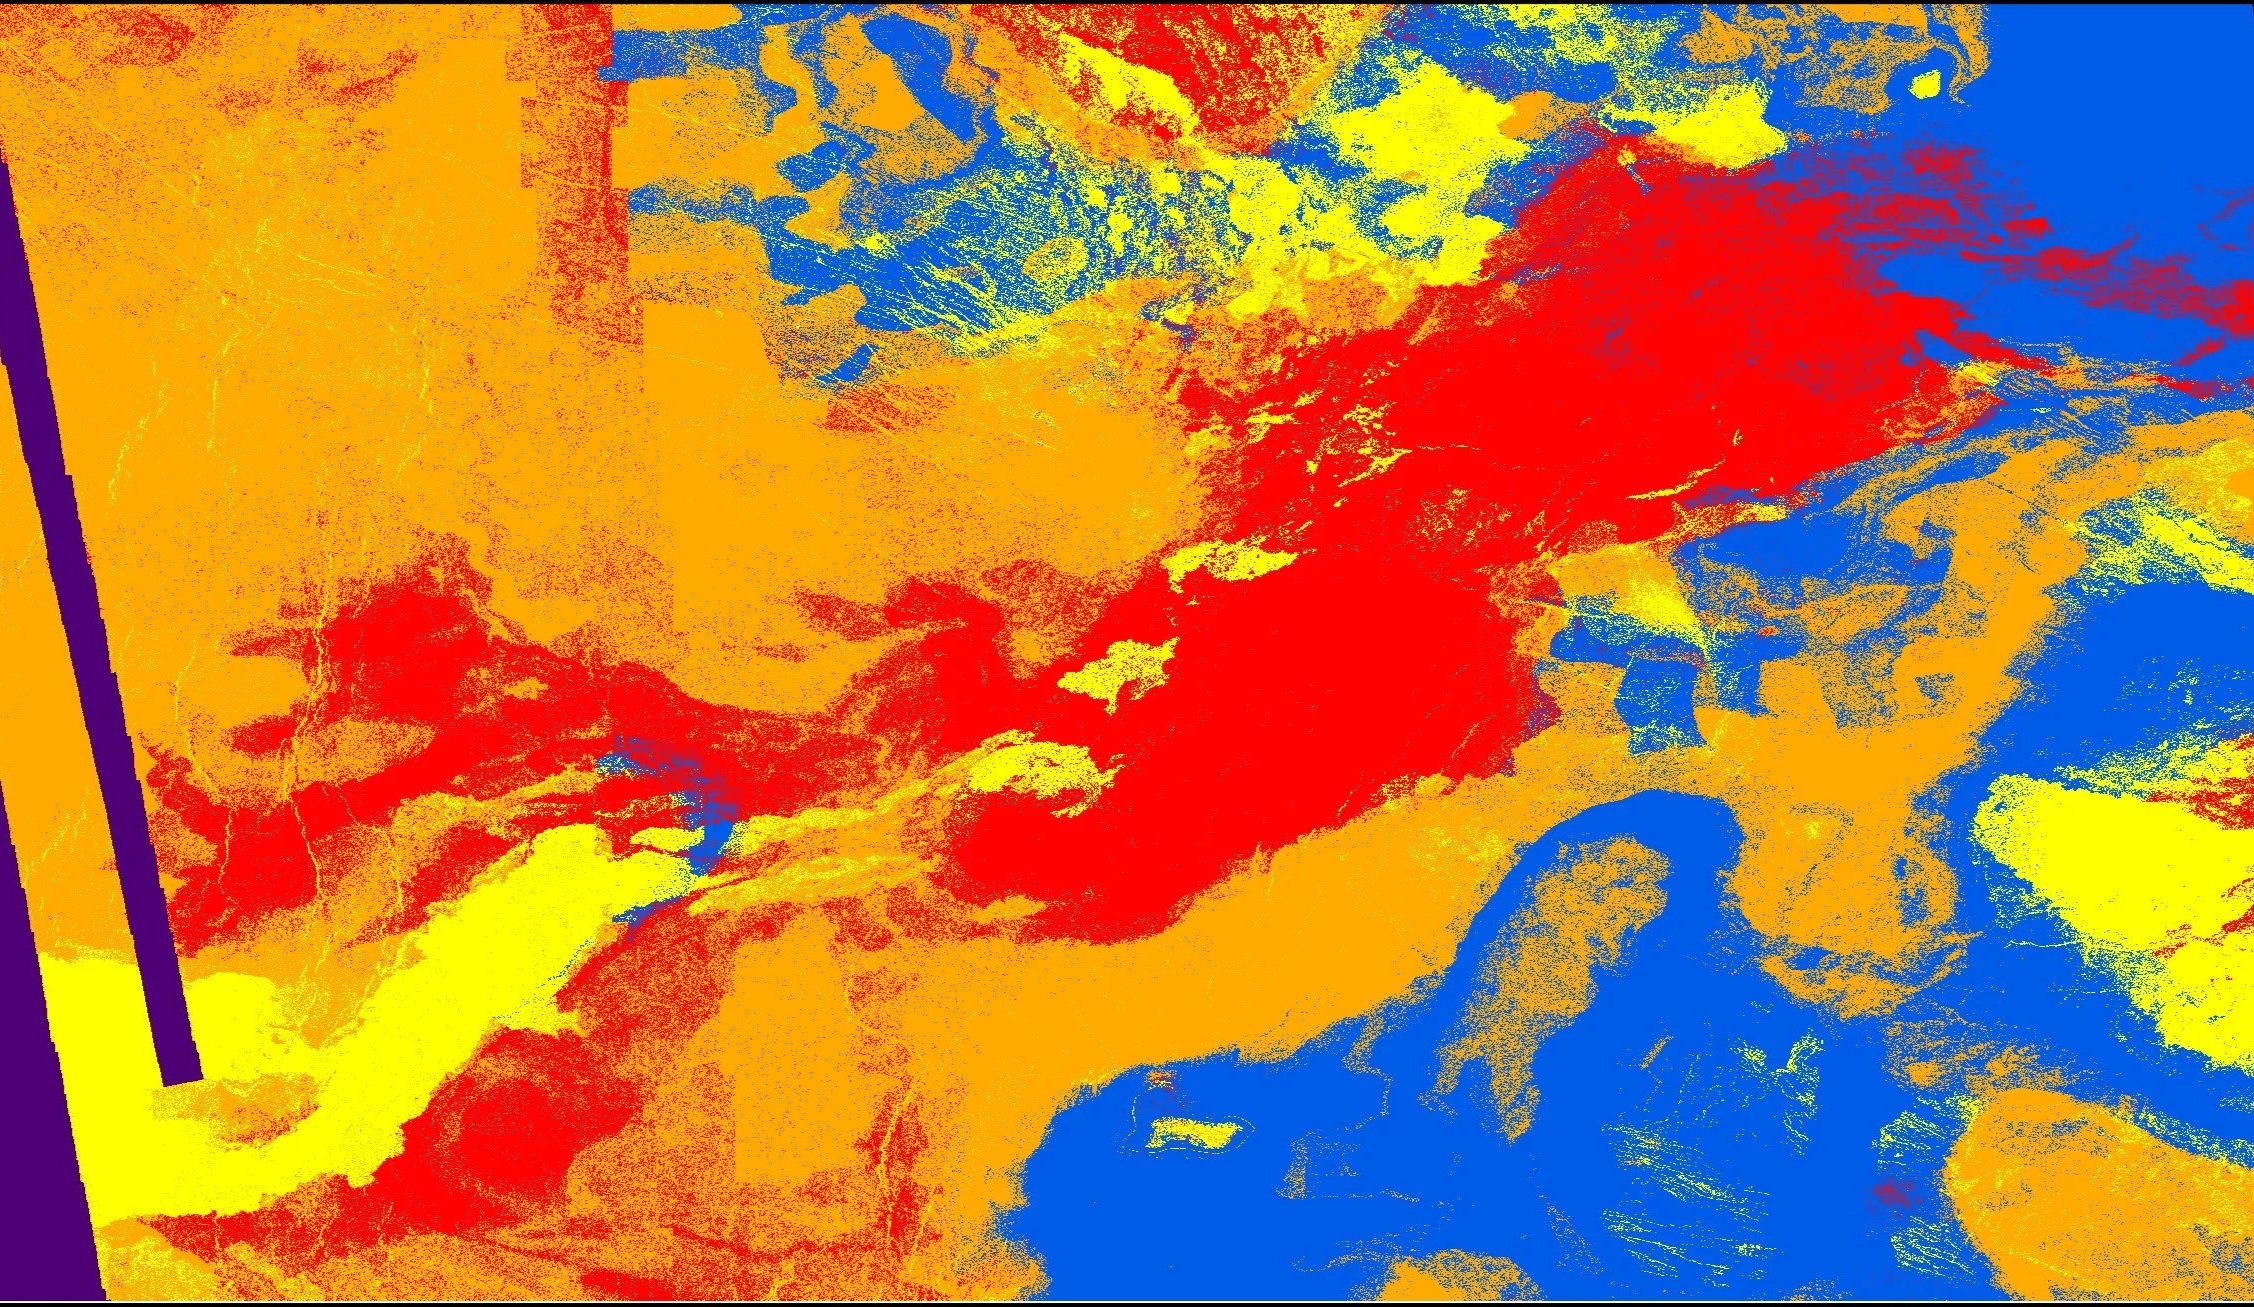
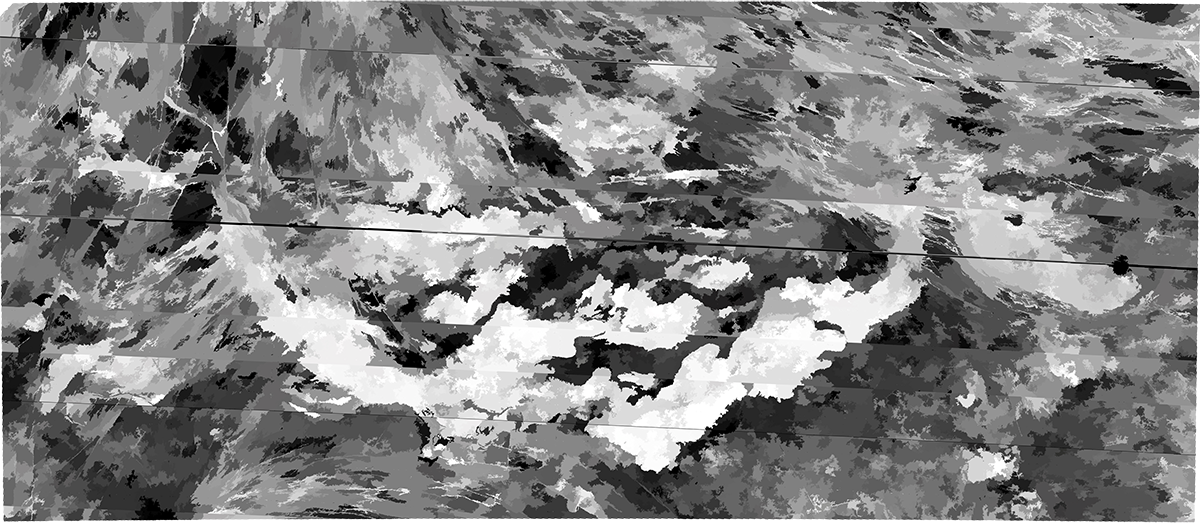
Fig. 26: Ningyo Fluctus Segmentation
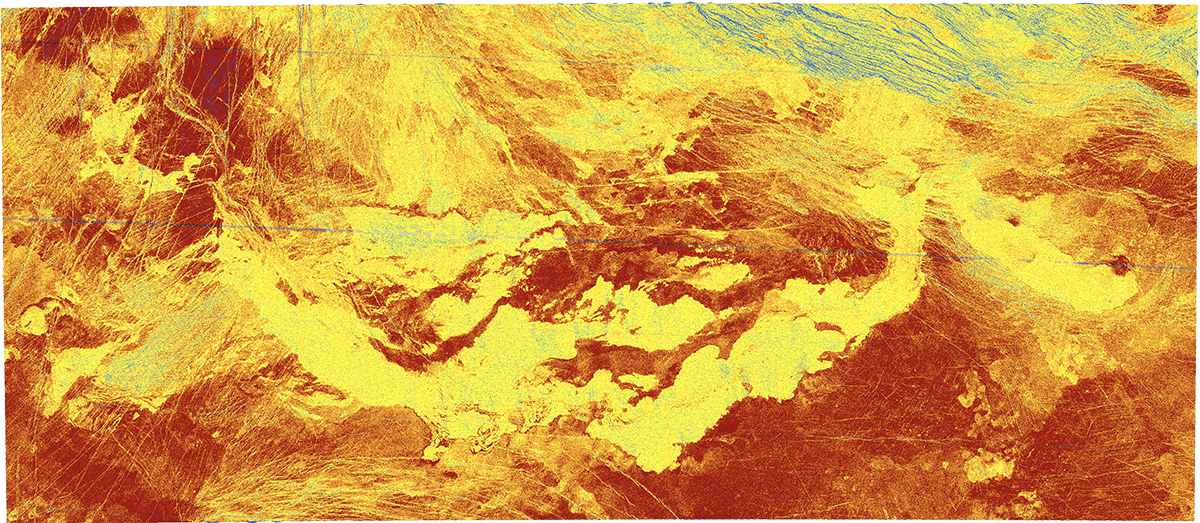
Fig. 30: Ningyo Fluctus Classification
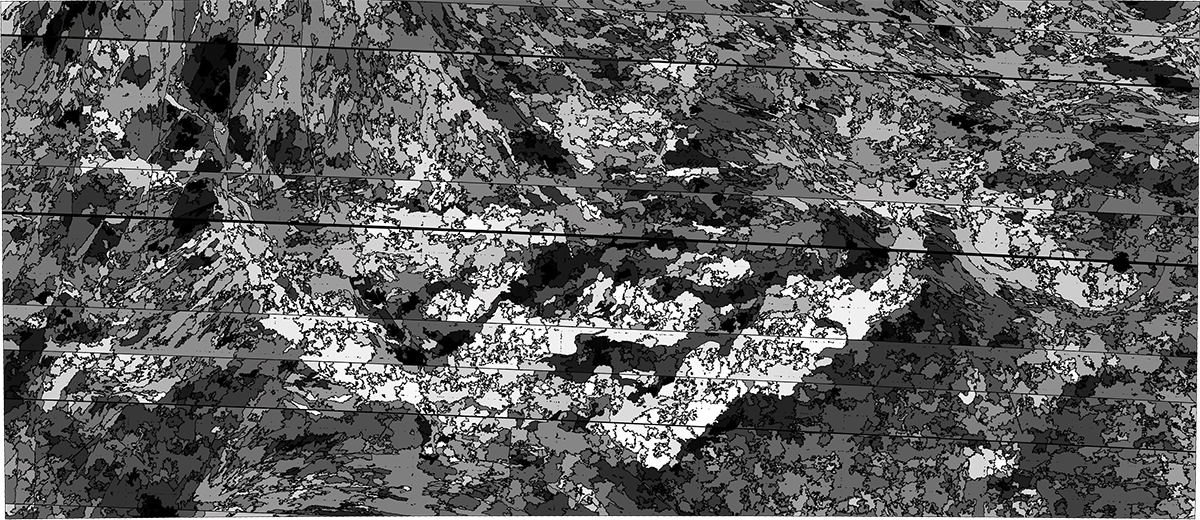
Fig. 34: Ningyo Fluctus Raster to Polygon
Manual mapping remained the most reliable method for delineating flow boundaries in Magellan SAR
Machine learning techniques showed promise but required significant tuning and preprocessing
Cartographic interpretation remains crucial for planetary radar datasets
As planetary missions like VERITAS generate higher-resolution datasets, understanding how cartographic workflows can scale, and where manual interpretation still adds value, helps improve mapping consistency, comparability, and scientific insight.
Poster Files
Click image for APCG Poster
Fig. 23: Eriu Fluctus 75M Composite Classification
Click image for GSA Poster (more in-depth)